CUET Preparation Today
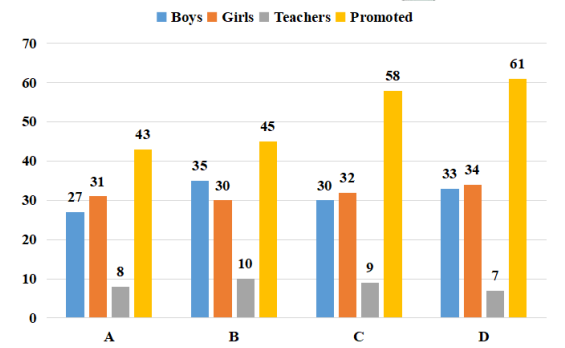
The given bar-graph shows the number of boys and girls in classes A, B, C and D in a school, the number of teachers allotted to each class and the number of students promoted to the next class.
Which class has the highest percentage of failed students? |
B D C A |
B |
In class A , Total number of students = 27 + 31 = 58 Number of failed students = 58 - 43 = 15 Percentage of failed students = \(\frac{15 }{58}\) × 100 = 25.86% In class B , Total number of students = 35 + 30 = 65 Number of failed students = 65 - 45 = 20 Percentage of failed students = \(\frac{20 }{65}\) × 100 = 30.76% In class C , Total number of students = 30 + 32 = 62 Number of failed students = 62 - 58 = 4 Percentage of failed students = \(\frac{4 }{62}\) × 100 = 6.45% In class D , Total number of students = 33 +34 = 67 Number of failed students = 67 - 61 = 6 Percentage of failed students = \(\frac{6 }{67}\) × 100 = 8.95% So , highest percentage of failed students is in class B . |