CUET Preparation Today
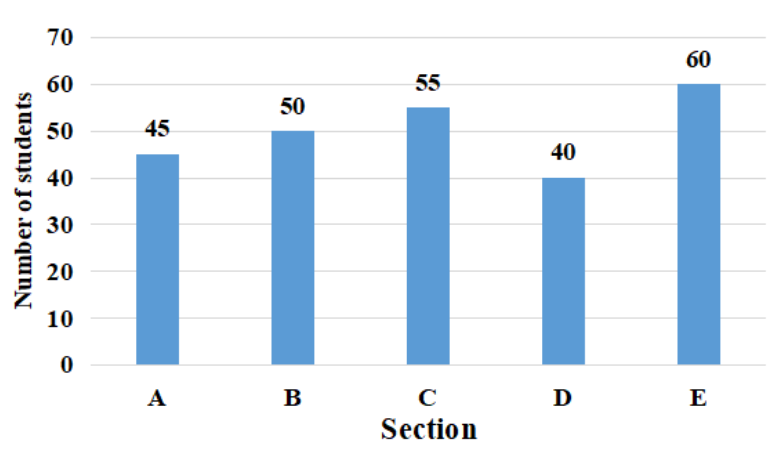
The following bar graph shows the number of students in five different sections of Class 10.
What is the positive difference between the numbers of students in Section C and in Section D? |
16 15 14 17 |
15 |
Number of students in section C = 55 Number of students in section D = 40 Difference b/w number of students in section C and D = 55 - 40 = 15 |