Goods X and Y are considered to be substitutes by a consumer. He is currently consuming good X. If the price of Good Y decreases, then arrange the following in correct sequence
(A) Demand for Good X decreases.
(B) Consumer finds Good Y to be relatively cheaper than Good X.
(C) Demand curve for Good X shifts to the left.
(D) Consumer shifts from Good X to Good Y.
Choose the correct answer from the options given below:
Answer & explanation
Correct answer: option 4
The correct answer is Option (4) → (B), (D), (A), (C)
Substitutes are goods that can be used in place of each other, such as tea and coffee. When one becomes cheaper, the demand for the other falls.
(B) Consumer finds Good Y to be relatively cheaper than Good X. — The chain starts with the fall in the price of Y. The price of X has not changed, so Y now looks cheaper.
(D) Consumer shifts from Good X to Good Y. — As the goods can replace each other, he buys more of Y in place of X.
(A) Demand for Good X decreases. — He now wants less X even though the price of X is the same.
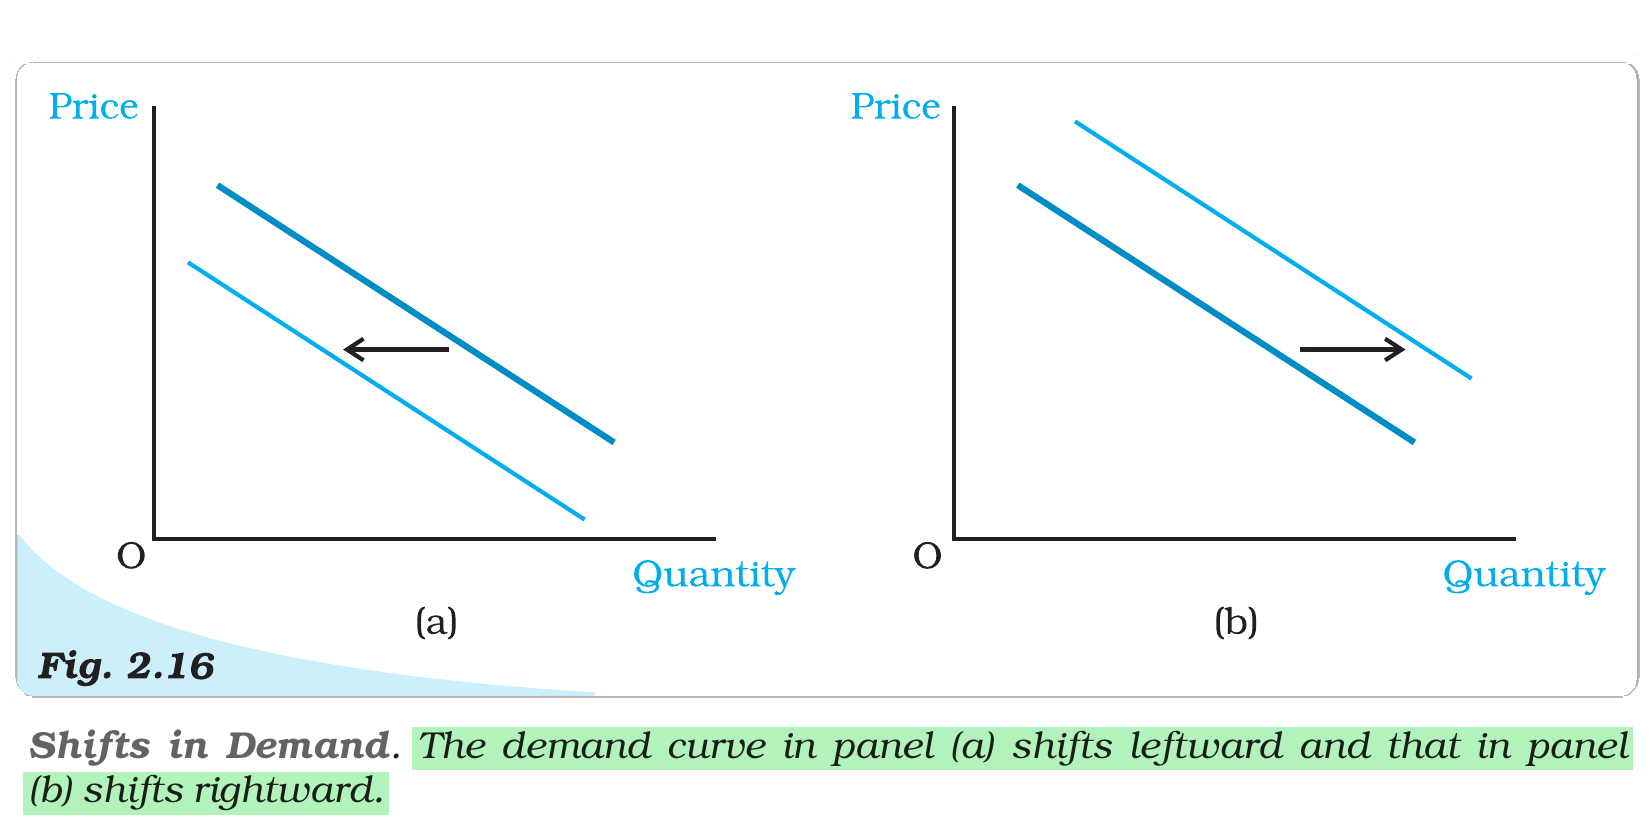
(C) Demand curve for Good X shifts to the left. — A fall in demand caused by another good’s price is shown on the graph as a leftward shift of the curve. So (C) comes with (A), as the picture of that change.
NCERT (2026-27): “2.4.4 Substitutes and Complements … In contrast to complements, goods like tea and coffee are not consumed together. In fact, they are substitutes for each other. Since tea is a substitute for coffee, if the price of coffee increases, the consumers can shift to tea, and hence, the consumption of tea is likely to go up. On the other hand, if the price of coffee decreases, the consumption of tea is likely to go down. The demand for a good usually moves in the direction of the price of its substitutes.… 2.4.5 Shifts in the Demand Curve … Given the consumer’s income and her preferences, if the price of a related good changes, the demand for a good at each level of its price changes, and hence, there is a shift in the demand curve. If there is an increase in the price of a substitute good, the demand curve shifts rightward.… Shifts in the demand curve are depicted in Figure 2.16.…”
|