CUET Preparation Today
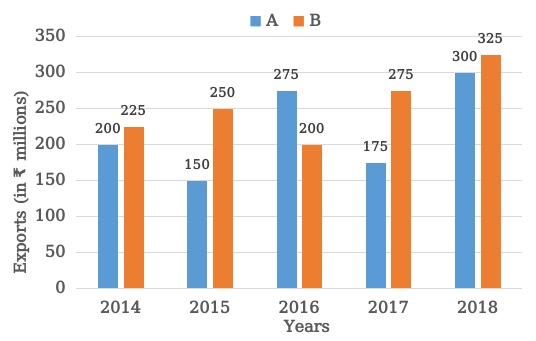
The following bar graph shows exports of cars of type A and B (in ₹ millions) from 2014 to 2018. Study the graph and answer the question that follows. Exports of Cars of Type A and B (in ₹ millions) during 2014 to 2018.
The total exports of cars of type A in 2014 to 2018 is what per cent more than the total exports of cars of type B in 2015 to 2017 ? (Correct to one decimal place) |
44.3% 50.4% 51.7% 41.3% |
51.7% |
Total exports of cars of type A in 2014 to 2018 = 200 + 150 + 275 + 175 + 300 = 1100 Total export of car of type B in 2015 to 2017 = 250 + 200 + 275 = 725 Required percentage = \(\frac{1100 - 725 }{725}\) × 100 = \(\frac{375 }{725}\) × 100 = 51.7% |