CUET Preparation Today
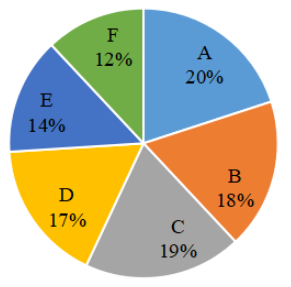
The following Pie chart represents the percentage-wise distribution of 300 students of class X in a school in six different sections A, B, C, D, E and F. The table given below shows the number of boys of class X in six different sections A, B, C, D, E and F.
If in section E, the ratio of the number of boys to the number of girls is 3 : 4, then the ratio of number of boys in section E to the number of girls in section D is : |
23 : 18 23 : 24 24 : 23 18 : 23 |
18 : 23 |
Number of Boys in section E = \(\frac{3}{7}\)× \(\frac{14}{100}\) ×300 = 18 Number of girls in section D = \(\frac{17}{100}\) ×300 - 28 = 51 - 28 = 23 Required ratio , 18 : 23 |