
Match List-I with List-II:
| List-I | List-II |
| A. Exponential growth | I. J-shaped curve when N is plotted against time |
| B. Logistic growth | II. Sigmoid curve when N is plotted against time |
| C. K in the logistic growth equation | III. Carrying capacity |
| D. e in the integral form of the exponential growth equation | IV. Base of natural logarithms |
Choose the correct answer from the options given below:
Answer & explanation
Correct answer: option 4
The correct answer is Option (4) → A-I, B-II, C-III, D-IV
The two growth models differ in their resources and in the shape of their curves. Each symbol in their equations also has a fixed meaning.
(A) Exponential growth — this matches (I) J-shaped curve when N is plotted against time. With unlimited resources the population keeps growing faster.
(B) Logistic growth — this matches (II) Sigmoid curve when N is plotted against time. With limited resources growth goes through a lag phase, acceleration and deceleration, and then levels off.
(C) K in the logistic growth equation — this matches (III) Carrying capacity, the maximum number the habitat’s resources can support.
(D) e in the integral form of the exponential growth equation — this matches (IV) Base of natural logarithms, a mathematical constant (about 2.718).
So the correct match is A-I, B-II, C-III, D-IV.
NCERT Extract:
Growth Models – “… The above equation describes the exponential or geometric growth pattern of a population (Figure 11.3) and results in a J-shaped curve when we plot N in relation to time. … e = the base of natural logarithms (2.71828)”
Growth Models – “… Let us call this limit as nature’s carrying capacity (K) for that species in that habitat. A population growing in a habitat with limited resources show initially a lag phase, followed by phases of acceleration and deceleration and finally an asymptote, when the population density reaches the carrying capacity. A plot of N in relation to time (t) results in a sigmoid curve.”
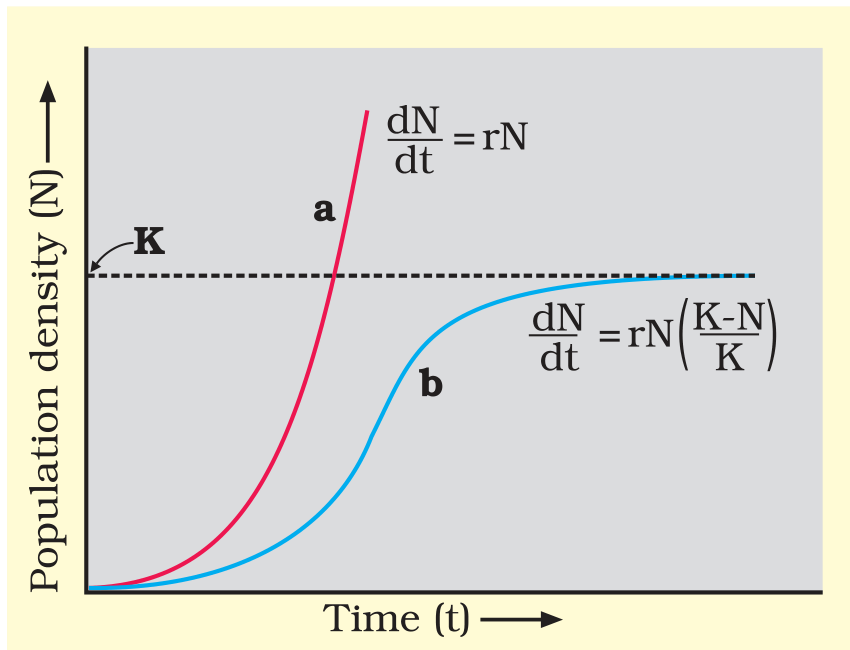
Figure 11.3 Population growth curve: a when responses are not limiting the growth, plot is exponential; b when responses are limiting the growth, plot is logistic; K is carrying capacity