CUET Preparation Today
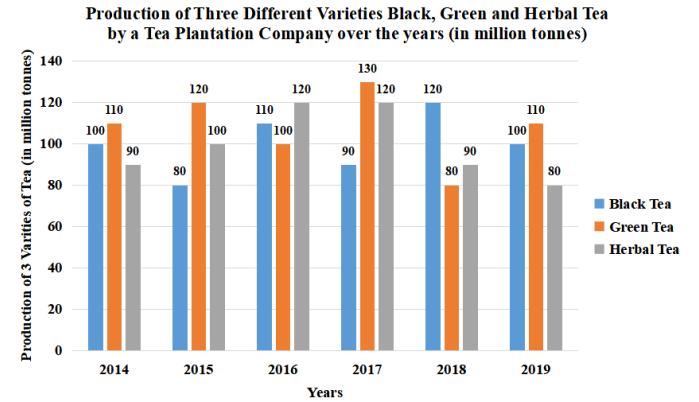
Study the given bar graph and answer the question that follows. A tea plantation company produces three varieties of tea—black tea, green tea and herbal tea. The production of three varieties (in million tonnes) over a period of six years from 2014 to 2019. has been shown in the bar graph here. The X-axis represents the years and the Y-axis displays the production of the three varieties in million tonnes.
The total production of green tea in 2016 and 2018 is what percent of the total production of herbal tea in 2015 and 2017 ? |
83.4 85.6 79.7 81.8 |
81.8 |
Total production of green tea in 2016 and 2018 = 100 + 80 = 180 Total production of herbal tea in 2015 and 2017 = 100 + 120 = 220 Required percentage = \(\frac{180 }{220}\) × 100 = \(\frac{9 }{11}\) × 100 = 81.8% |