CUET Preparation Today
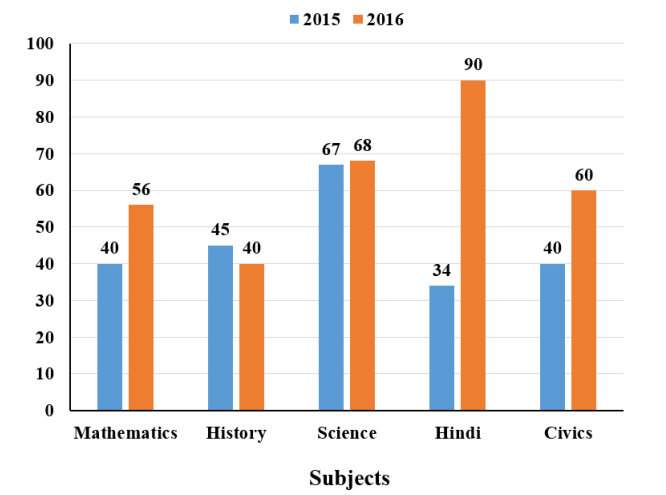
The following bar graph shows the marks of a student from 5 different subjects in 2015 and 2016. Total marks scored in History for 2016. Is what percent of die total marks of Civics for both years?
|
55 40 60 50 |
40 |
Marks of History in 2016 = 40 Marks of civics for both years = 40 + 60 = 100 Required difference = \(\frac{40}{100}\) × 100 = 40% |