CUET Preparation Today
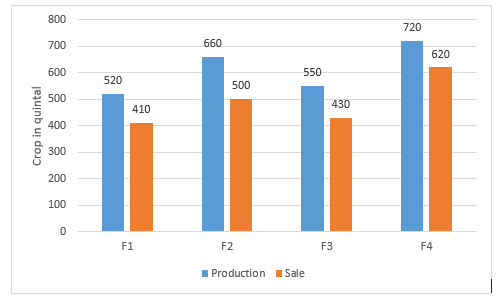
The given bar graph represents the production and sales of a certain crop in quintals by the farmers F1, F2, F3 and F4.
Which farmer recorded the highest percentage of sales with respect to the production? |
F3 F1 F2 F4 |
F4 |
Percentage of sale with respect to production of F1 = \(\frac{410 }{520}\) × 100 = 78.84% Percentage of sale with respect to production of F2 = \(\frac{500 }{660}\) × 100 = 75.76% Percentage of sale with respect to production of F3 = \(\frac{430 }{550}\) × 100 = 78.18% Percentage of sale with respect to production of F4 = \(\frac{620 }{720}\) × 100 = 86.11% Highest percentage of sales with respect to the production is of F4. |