CUET Preparation Today
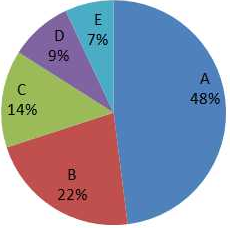
The given pie-chart represents the distribution of the percentage of sales of a particular brand of car from five showrooms A, B, C, D and E during 2018. The total number of cars sold during that year from the five showrooms is 5000.
What is the central angle (nearest to 0.1 degree) of the sector corresponding to the sales from the showroom C? |
60.5 50.4 48.6 56.7 |
50.4 |
Central angle corresponding to sale from showroom C = \(\frac{14}{100}\) × 360º = 50.4º |