CUET Preparation Today
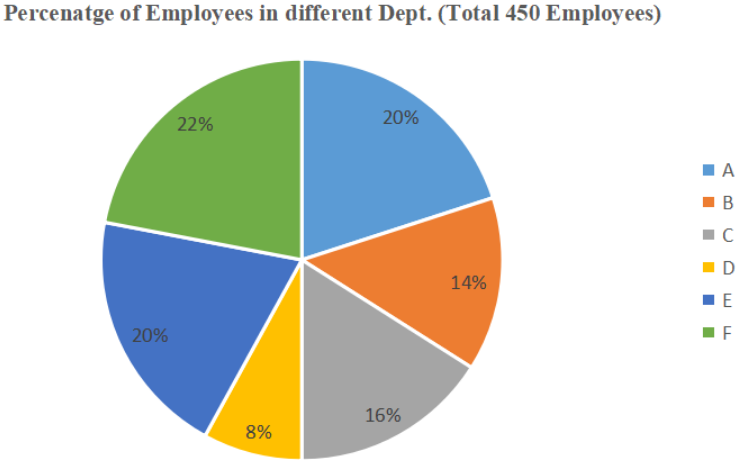
The given pie chart shows the percentage distribution of 450 employees in an organisation. Study the pie chart and answer the question that follows.
What is the central angle of the sector representing the number of employees in department A? |
72° 108° 36° 90° |
72° |
Central angles corresponding to employees in A = \(\frac{20}{100}\) × 360º = \(\frac{1}{5}\) × 360º = 72º |