
Consider an economy with a fixed amount of resources and a given state of technology. It produces only two goods, Goods A and Goods B. The combinations showing the maximum output of the two goods that can be produced (when the given resources and technology are fully used) are plotted on a graph and joined to form the curve below. Two other points, E and F, are also marked on the graph.
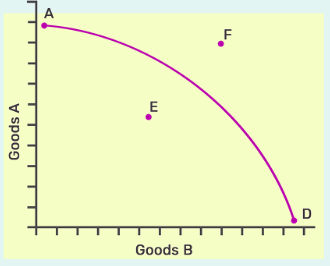
Based on the above graph, answer the following questions.
What does point A represent?
Answer & explanation
Correct answer: option 3
The correct answer is Option (3) → Efficient utilisation of resources
Point A lies on the curve, at its end on the Goods A axis. Points on the curve are produced when the given resources are fully utilised, with no idle or wasted resource. So A shows efficient use of resources.
Option (1) Underutilisation of resources — Incorrect. Underuse of resources gives a point below the curve, like E.
Option (2) Unattainable point — Incorrect. An unattainable point lies beyond the curve, like F.
Option (3) Efficient utilisation of resources — Correct. A point on the curve uses the resources fully.
Option (4) Maximum output of Goods B — Incorrect. A lies where the curve meets the Goods A axis. There the economy makes the most Goods A and no Goods B.
NCERT (2026-27): “Production Possibility Frontier The production possibility frontier gives the combinations of corn and cotton that can be produced when the resources of the economy are fully utilised. Note that a point lying strictly below the production possibility frontier represents a combination of corn and cotton that will be produced when all or some of the resources are either underemployed or are utilised in a wasteful fashion.” |