
The figure shows the distribution of kinetic energy among the molecules of a gas at a given temperature.
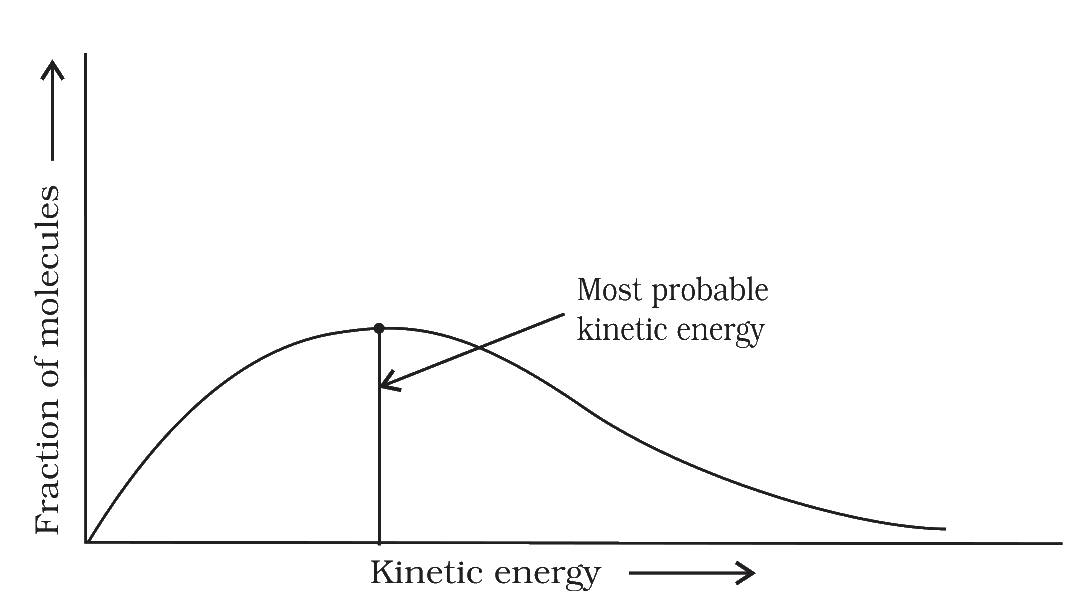
What does the total area under this curve represent?
Answer & explanation
Correct answer: option 2
The correct answer is Option (2) → The sum of the fractions of all the molecules of the gas, which is equal to one
The y-axis of the figure is the fraction of molecules, NE/NT, having a given kinetic energy E, where NT is the total number of molecules. The area under the curve adds up these fractions over all the energies, so every molecule is counted once: the sum is NT/NT = 1, the total probability.
Why the other options are incorrect
Option (1) The fraction of molecules having the most probable kinetic energy — Incorrect. This fraction is the height of the curve at its peak, a single point, not the whole area.
Option (3) The fraction of molecules having kinetic energy higher than the most probable kinetic energy — Incorrect. This is only the part of the area to the right of the line from the peak; the total area also includes the molecules to its left.
Option (4) The total kinetic energy of all the molecules of the gas — Incorrect. The curve plots fractions of molecules, not energies; adding the fractions counts the molecules and gives 1, not their total energy.
NCERT (2026-27 edition):
3.4 Temperature Dependence of the Rate of a Reaction – “According to them, the distribution of kinetic energy may be described by plotting the fraction of molecules (NE/NT) with a given kinetic energy (E) vs kinetic energy (Fig. 3.8). Here, NE is the number of molecules with energy E and NT is total number of molecules.”
“The area under the curve must be constant since total probability must be one at all times.”
Fig. 3.8: Distribution curve showing energies among gaseous molecules