
CUETMOCK
  • Pricing
  • Mentors
Log inStart freeStart free mocks→

First test, then trust

Try a free CUET mock test.

Join 5,00,000+ students who rehearsed exam day on the exact NTA screen before sitting CUET. On the web and on Android.

Start free mocks →Get the Android app
CUETMOCK

India's #1 CUET Mock Test Platform. Original NCERT-based questions on the exact NTA exam screen — trusted by 5,00,000+ students since CUET 2022.

Get it onGoogle PlayScan to download the CUETMOCK app

Mock tests

  • CUET mock test series
  • Commerce mocks
  • Humanities (Arts) mocks
  • Science mocks
  • Languages & GAT mocks
  • Free practice questions
  • Pricing

Resources

  • CUET exam guide
  • CUET syllabus
  • Universities accepting CUET
  • Expert blogs
  • News & notifications
  • Webinars & counselling
  • CUET score calculator
  • How we estimate your rank
  • FAQs

Company

  • About us
  • Our leadership & team
  • Our toppers
  • Mentors
  • For schools
  • Contact us
  • Terms
  • Privacy
  • Refund policy

Talk to us

+91 7696 6630 56info@cuetmock.comWhatsApp us

Our other platforms

  • JEE Mock — For IIT-JEE aspirants
  • NEET Mock — For NEET aspirants

Newsletter

Exam updates, study material and offers — no spam.

© 2026 NYC Ventures Pvt. Ltd.

701-702, Royal Business Park, Zirakpur, Punjab - 140603

  • Terms of use
  • Privacy policy
  • Refund policy
  • Contact us

iCUETMOCK is an independent preparation platform, not affiliated with the National Testing Agency (NTA). Always check exam details on the official NTA website.

  • Home
  • Mock tests
  • CUET guide
  • Pricing
  • Log in
Home/Practice questions/Chemistry
ChemistryPhysical: Solutions

The figure shows the partial vapour pressures and the total vapour pr…

The figure shows the partial vapour pressures and the total vapour pressure over an ideal solution of two volatile liquids, components 1 and 2, plotted against the mole fraction at constant temperature.
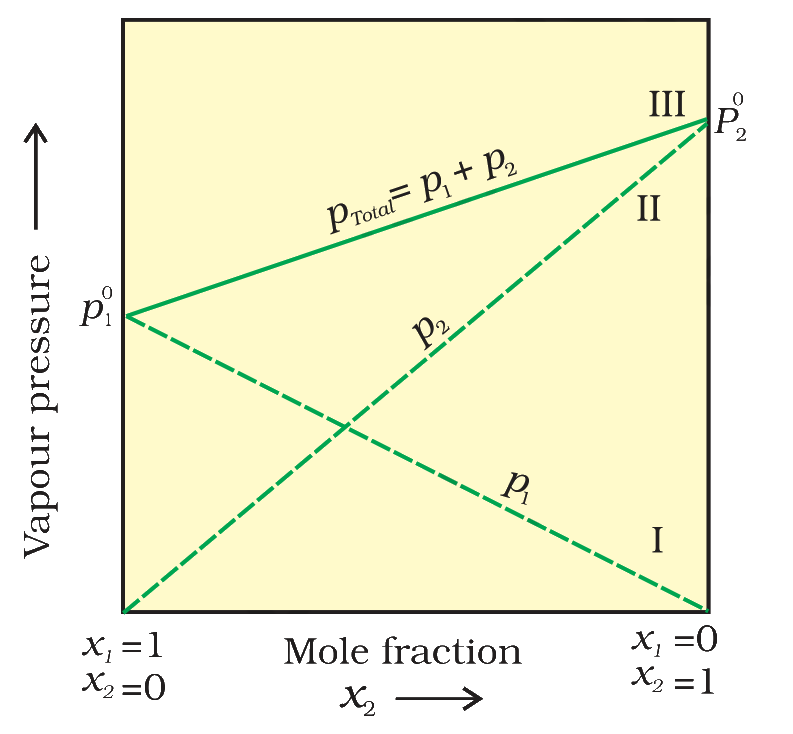
Vapour pressure against mole fraction for an ideal solution

Which component of this solution is more volatile?

Answer & explanation+

Correct answer: option 3

The correct answer is Option (3) → Component 2, because the vapour pressure of pure component 2, p20, is higher than p10.

At the same temperature, the more volatile liquid is the one with the higher vapour pressure in the pure state. In the figure each partial-pressure line reaches the vapour pressure of its pure component where its mole fraction is 1.

  • Reading the figure — p10 is on the left axis (x1 = 1) and p20 on the right axis (x2 = 1). The point p20 is higher, and the total vapour pressure rises from p10 to p20.

  • More volatile — component 2, since p10 < p20.

Why the other options are incorrect

Option (1) Component 1, because its partial vapour pressure p1 falls as x2 increases. — Incorrect. p1 falls only because there is less of component 1 as x2 increases. The partial pressure of each component falls as its own mole fraction falls; this says nothing about volatility.

Option (2) Component 1, because the line of p1 starts from the vapour pressure axis on the left. — Incorrect. Where a line starts depends only on how the mole-fraction axis is drawn. Volatility is judged by the height of p10 and p20, and p10 is the lower one.

Option (4) Neither, because the line of the total vapour pressure is straight, so both are equally volatile. — Incorrect. The line is straight because the solution is ideal. It slopes upward from p10 to p20; if the two liquids were equally volatile it would be horizontal.

NCERT (2026-27 edition):
1.4.1 Vapour Pressure of Liquid-Liquid Solutions – “A plot of p1 or p2 versus the mole fractions x1 and x2 for a solution gives a linear plot as shown in Fig. 1.3. These lines (I and II) pass through the points for which x1 and x2 are equal to unity. Similarly the plot (line III) of ptotal versus x2 is also linear (Fig. 1.3). The minimum value of ptotal is p10 and the maximum value is p20, assuming that component 1 is less volatile than component 2, i.e., p10 < p20.”

Fig. 1.3

Fig. 1.3: The plot of vapour pressure and mole fraction of an ideal solution at constant temperature. The dashed lines I and II represent the partial pressure of the components. (It can be seen from the plot that p1 and p2 are directly proportional to x1 and x2, respectively). The total vapour pressure is given by line marked III in the figure.

Advertisement

Practise more on Physical: Solutions

Chapter-wise mocks on the real NTA exam screen, with solutions and your rank. Your first mocks are free.

Start free mocks →

Advertisement

Next questions

  1. Two trains A and B start their journey from X and Y respectively towards each other. When they will cross each other then, train A and B wi…General Aptitude Test · Numerical Ability
  2. Mughal emperor Shah Jahan got the monument Taj Mahal constructed in memory of his wife ______.General Aptitude Test · General Knowledge
  3. Spot the error in the following sentence and choose the appropriate option."The committee have made its decision about the new policy."English · Spot Error
  4. The phrase sea change, as used in the passage, meansEnglish · Comprehension - (Narrative / Factual)
  5. Which of the following nouns is of neuter gender?English · Grammar: Gender
  6. Electrical capacity of earth is approximately :Physics · Electrostatic Potential and Capacitance
  7. The expression ‘Aya Ram, Gaya Ram’ is used to refer ______.Political Science · Politics in India Since Independence: Challenges to and Restoration of the Congress System
  8. Name the places where the Independent governments were formed during the Quit India movement:History · Modern India: Mahatma Gandhi and the Nationalist movement
  9. ∫≤ftdisplaystyle1/(log x)-1/((log x)^2)dx , where x gt 1 , is equal to (C is a constant of integration)Maths. Section B1 · Indefinite Integration
  10. Select the option that expresses the given sentence in active voice. I was fascinated by the movie.English · Grammar: Active Passive Voice