CUET Preparation Today
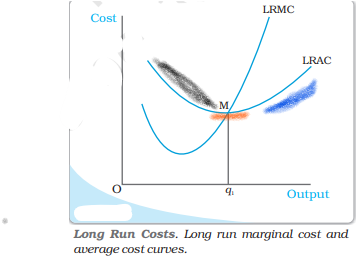
Study the given figure. The portion of LRAC curve highlighted by black colour in the graph explains which concept?
|
Increasing returns to Scale Decreasing returns to scale Law of variable proportions Cobb Douglas Function |
Increasing returns to Scale |
The correct answer is Option 1: Increasing returns to Scale IRS implies that if we increase all the inputs by a certain proportion, output increases by more than that proportion. In other words, to increase output by a certain proportion, inputs need to be increased by less than that proportion. With the input prices given, cost also increases by a lesser proportion. For example, suppose we want to double the output. To do that, inputs need to be increased, but less than double. The cost that the firm incurs to hire those inputs therefore also need to be increased by less than double. What is happening to the average cost here? It must be the case that as long as IRS operates, average cost falls as the firm increases output. It is argued that in a typical firm IRS is observed at the initial level of production. This is then followed by the CRS and then by the DRS. Accordingly, the LRAC curve is a ‘U’-shaped curve. Its downward sloping part corresponds to IRS and upward rising part corresponds to DRS. At the minimum point of the LRAC curve, CRS is observed. LRAC reaches its minimum at q1 . To the left of q1 , LRAC is falling and LRMC is less than the LRAC curve. |