CUET Preparation Today
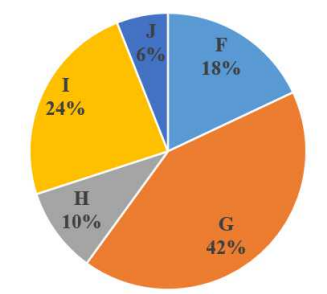
The pie chart given below show the runs scored by 5 batsmen in a cricket match. Total runs scored by these batsmen are 300. Runs scored by a batsman is shown as a percentage of runs scored by all these five batsmen.
What is the average runs scored in F, I and J? |
48 36 42 58 |
48 |
Total runs scored in F , I & J = ( 18% + 24% + 6% ) of 300 = \(\frac{48}{100}\) × 300 = 144 Average runs scored in F , I & J = \(\frac{144}{3}\) = 48 |