CUET Preparation Today
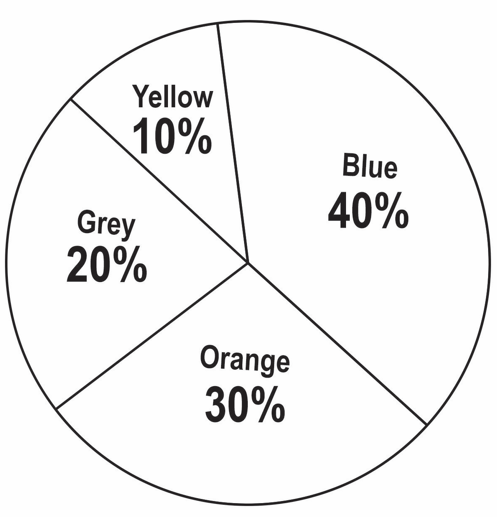
The following pie chart shows the different colored dresses worn by 120 students in a college party. Study the pie chart and answer the question that follows.
The no. of students who wore grey colored dress is how much percent less than the no. of students who wore orange dress? |
50% 33.33% 16.66% 10% |
33.33% |
No. of students who wore grey = 120 × 20% = 24 No. of students who wore orange = 120 × 30% = 36 Difference = 36 - 24 = 12 Req. Percentage = \(\frac{12}{36}\) × 100 = 33.33% |