CUET Preparation Today
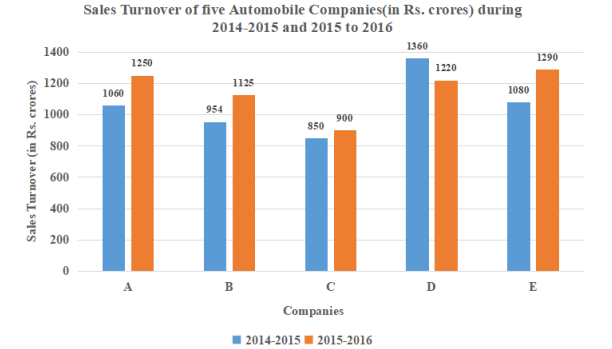
Study the given bar graph and answer the question that follows. The given bar graph represents the Sales Turnover (in ₹ crore) of five automobile companies A, B, C, D and E during 2014-2015 and 2015-2016. The X-axis represents the Companies, and the Y-axis shows the Sales Turnover (in ₹ crore). (The data shown here is only for mathematical exercise. They do not represent the actual figures of the company.)
Which two companies have the same percentage increase in the sales turnover from 2014-2015 to 2015-2016? |
B and C A and B A and D B and E |
A and B |