CUET Preparation Today
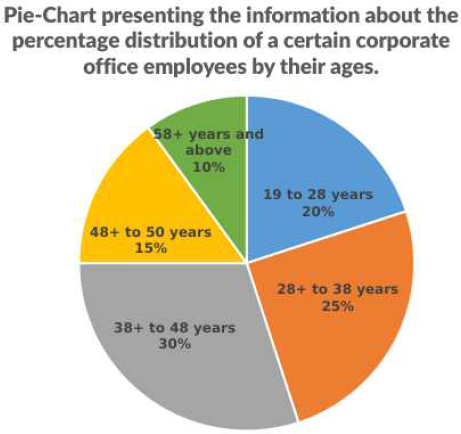
The following pie chart shows the distribution of percentage of a certain corporate office employees in various age- groups. Total number of employees of the corporate office = 2500 Study the chart carefully and answer the question that follows.
The number of the corporate office employees of age group of 38+ years and above is how much percentage more than that of 28+ to 38 years? |
80% 150% 120% 20% |
120% |
corporate office employees of age group of 38+ years and above = 10% + 30% + 15% = 55% corporate office employees of age group of 28+ to 38 years = 25% Required percentage = \(\frac{55 - 25}{25}\) × 100 = \(\frac{30}{25}\) × 100 = 120% |