CUET Preparation Today
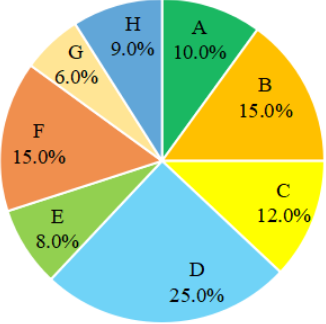
The following pie chart shows the number of workers of different categories A, B, C, D, E, F, G and H in a factory in 1995.
What is the central angle (angular value) for category B of the pie chart? |
55° 54° 57° 56° |
54° |
Central angle (angular value) for category B = \(\frac{15}{100}\) × 360º = 54º |