CUET Preparation Today
Study the given graph and answer the question that follows.
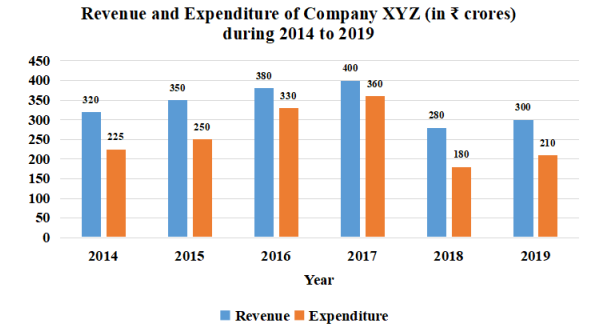
What is the ratio of the total revenue of the company in 2015 and 2018 to the total expenditure in 2017 and 2018? |
9 : 10 6 : 5 7 : 6 5 : 4 |
7 : 6 |
Total revenue of the company in 2015 and 2018 : Total expenditure in 2017 and 2018 ( 350 + 280 ) : ( 360 + 180 ) 630 : 540 7 : 6 |