
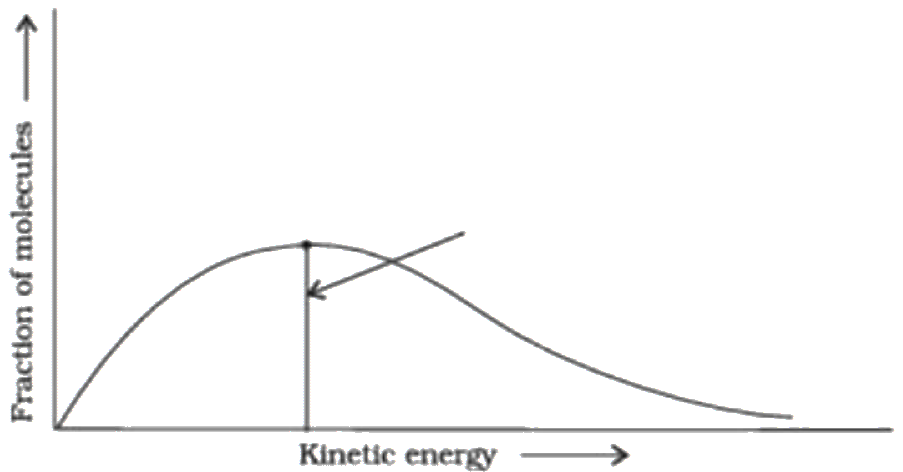
The peak in the following graph refers to-
Answer & explanation
Correct answer: option 3
The correct answer is Option (3) → Most Probable Kinetic Energy.
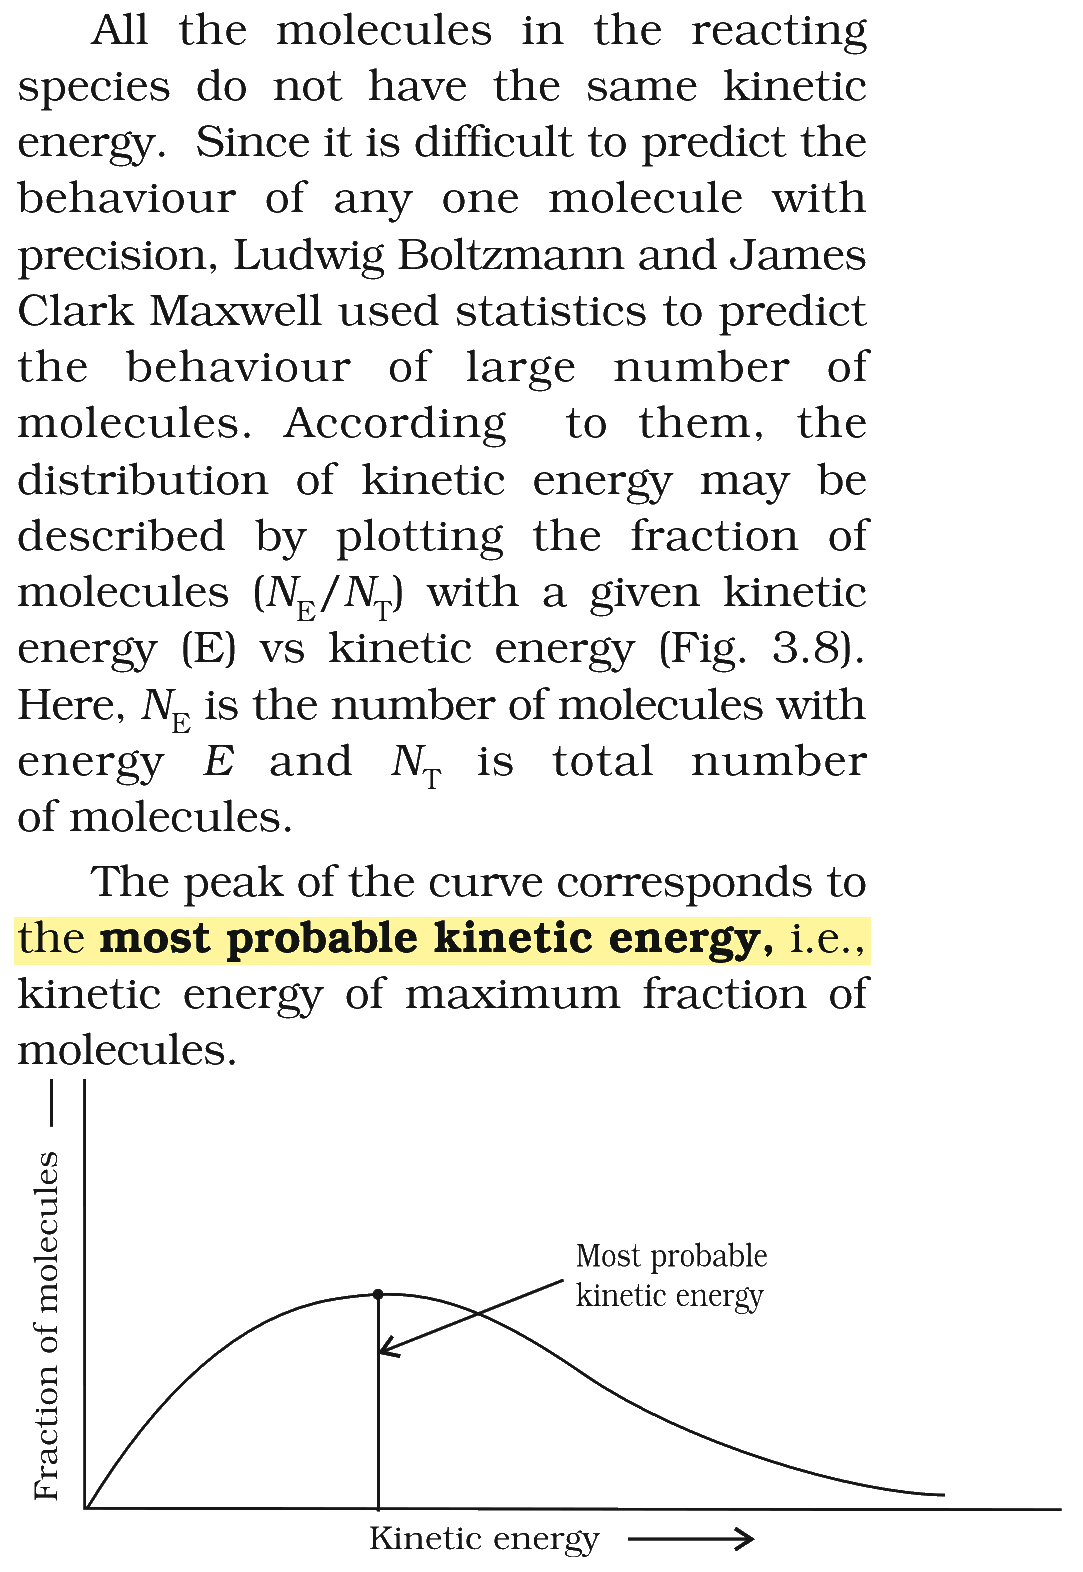
At a given temperature the molecules of a gas have a spread of kinetic energies. The peak of the Maxwell–Boltzmann curve is the energy held by the largest fraction of molecules, the most probable kinetic energy. The activation energy lies far out in the right-hand tail, where only a small fraction of molecules reach it.
Why the other options are incorrect
Option (1) Activation energy. — Incorrect. Only a small fraction of molecules have energy equal to or greater than the activation energy. So it is marked far out in the right-hand tail of the curve, not at the peak.
Option (2) Potential Energy. — Incorrect. The curve plots kinetic energy only; potential energy does not appear in it.
Option (4) Frequency. — Incorrect. The curve shows the fraction of molecules at each kinetic energy; collision frequency is a separate quantity, related to the factor A of the Arrhenius equation.
NCERT (2026-27 edition):
Temperature Dependence of the Rate of a Reaction – …
Note: The same/similar question has been asked in different years by NTA as per the details given below:
| 2026 | 2025 | 2024 | 2023 | 2022 |
|---|---|---|---|---|
| 31-05 S2 30-05 S2 12-05 S2 | – | – | 10-06 S1 | – |