CUET Preparation Today
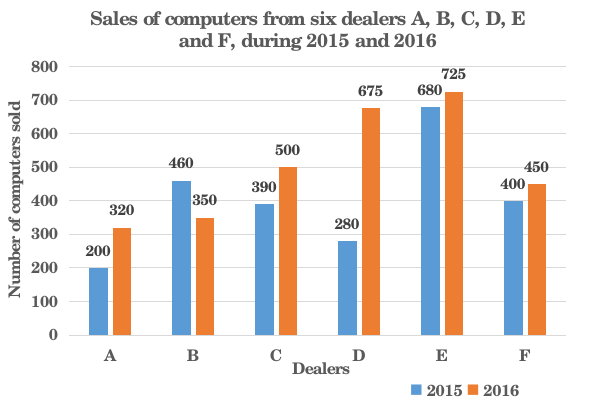
The given bar graph shows the sales of computers from six dealers A, B, C, D, E and F, during two consecutive years 2015 and 2016. Study the graph and answer the question that follows.
What is the ratio of the total sales from dealers A, B and C taken together for the year 2015 to the sales from dealers D. E and F taken together for the year 2016? |
25 : 39 37 : 21 21 : 37 39 : 25 |
21 : 37 |
Total Sales of A, B & C in 2015 : Total Sales of D , E & F in 2016 ( 200 + 460 + 390 ) : (675 + 725 + 450 ) 1050 : 1850 21 : 37 |