CUET Preparation Today
Study the given graph and answer the following question.
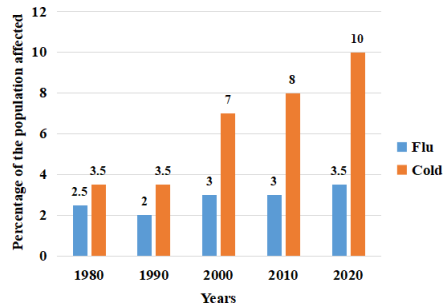
As per data available in the table above. what was the approximate percentage increase the percentage of the population affected by cold in 2020 when compared to the percentage of the population affected by cold in 1990? |
43% 70% 186% 333% |
186% |
Percentage of population affected by cold in 1990 = 3.5 Percentage of population affected by cold in 2020 = 10 Required percentage = \(\frac{10 - 3.5 }{3.5}\) × 100 = \(\frac{6.5}{3.5}\) × 100 = 186%
|