CUET Preparation Today
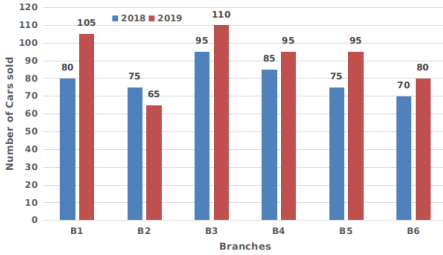
The given bar graph shows the sales of cars from six branches of a dealer B1, B2, B3, B4, B5, B6, during two consecutive years 2018 and 2019. Blue colour corresponds to the year 2018 and red colour corresponds to the year 2019.
The average sale of cars (from all branches) for the year 2018 is: |
78 90 85 80 |
80 |
Total sale of car in 2018 = 80 + 75 + 95 + 85 + 75 + 70 = 480 Average sale of car in 2018 = \(\frac{480}{6}\) = 80 |