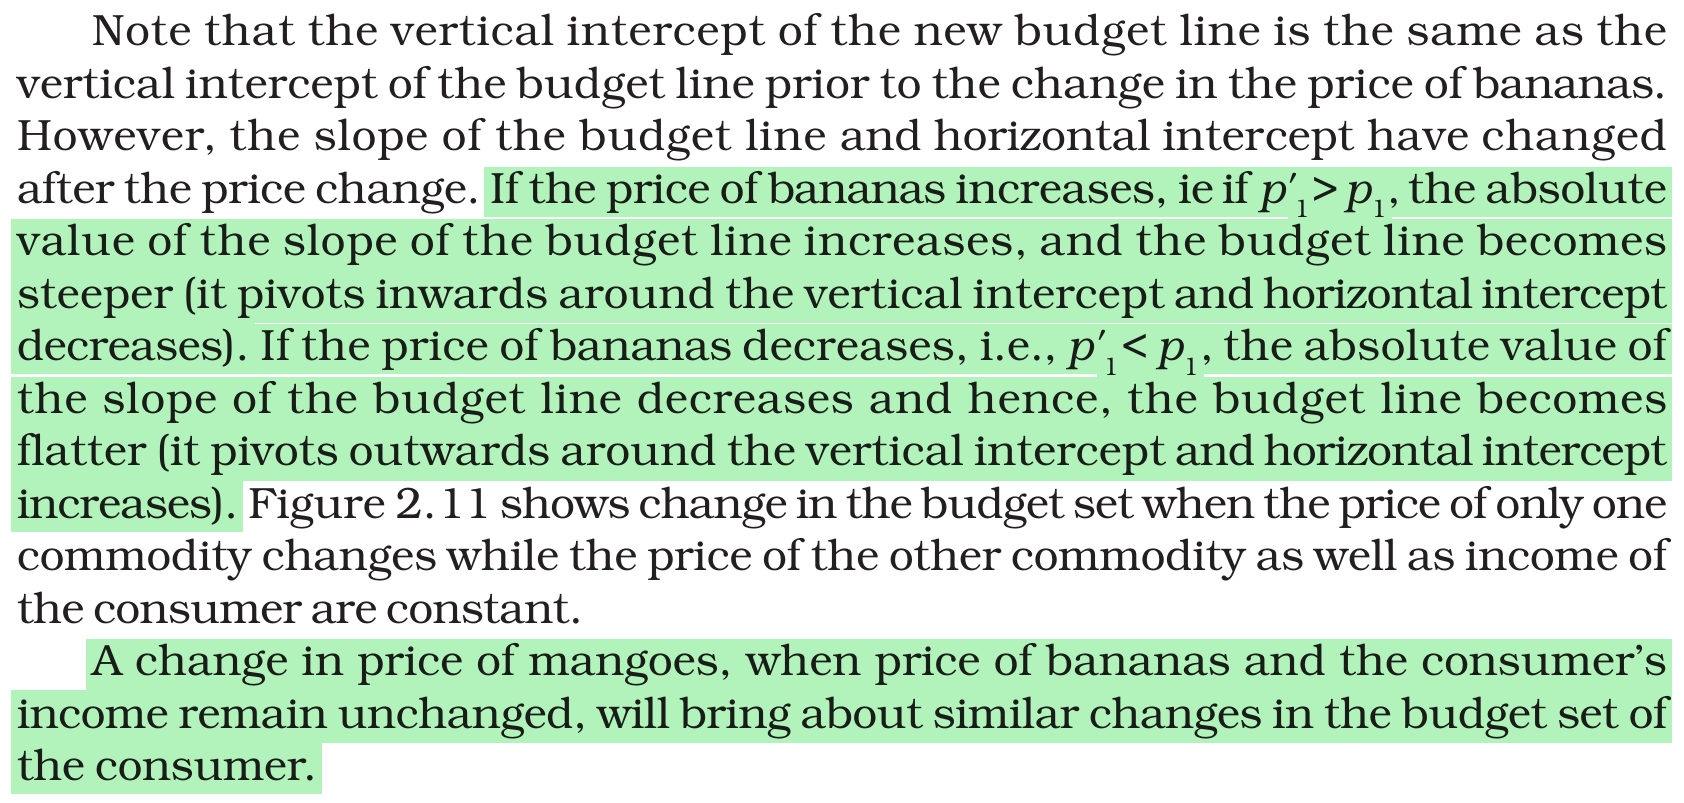
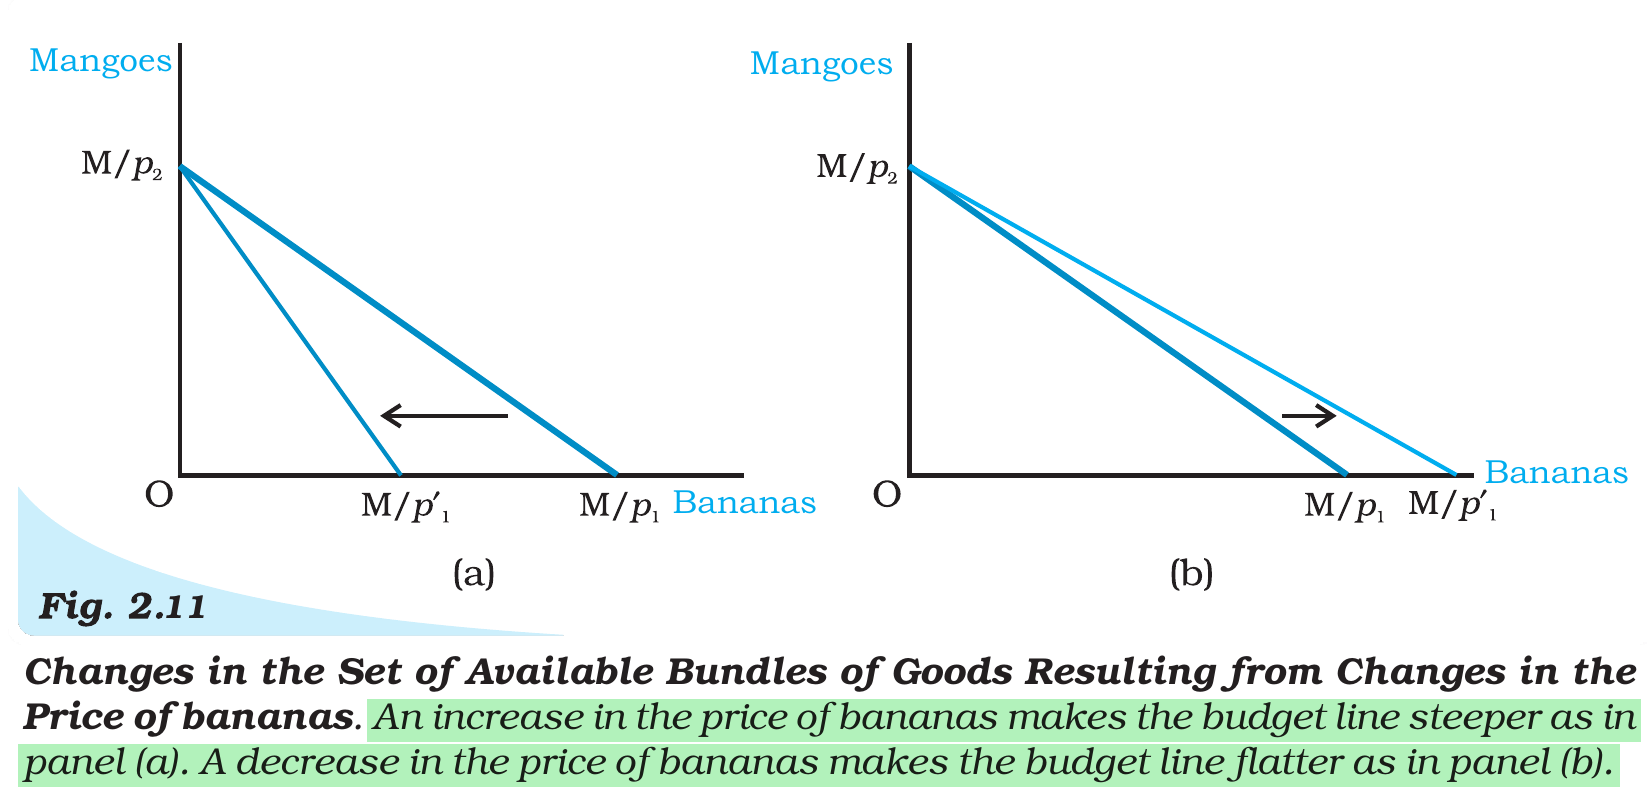
There are two goods, Good X and Good Y. Suppose there is an increase in the price of Good X and decrease in the price of Good Y simultaneously. Choose the correct diagram that shows its effect.
Answer & explanation
Correct answer: option 3
The correct answer is Option (3) → the diagram in Option (3)
BL is the old budget line, with Good x on the horizontal axis and Good y on the vertical axis. Each end of the line shows how much of one good the consumer’s whole income can buy.
A rise in the price of Good X means the income buys less of X. The end on the x-axis moves inwards, so L1 lies to the left of L.
A fall in the price of Good Y means the income buys more of Y. The end on the y-axis moves up, so B1 lies above B.
The new line B1L1 is therefore steeper than BL and crosses it.
Option (1) — Incorrect. B1 is below B and L1 is to the right of L. This shows a fall in the price of X and a rise in the price of Y, the opposite change.
Option (2) — Incorrect. Both ends move inwards and the new line is parallel to the old one. This happens when the consumer’s income falls while prices stay the same.
Option (3) — Correct. B1 is above B and L1 is to the left of L, as the two price changes require.
Option (4) — Incorrect. Both ends move outwards and the new line is parallel to the old one. This happens when income rises while prices stay the same.
NCERT (2026-27): Introductory Microeconomics — Chapter 2: Theory of Consumer Behaviour
|