CUET Preparation Today
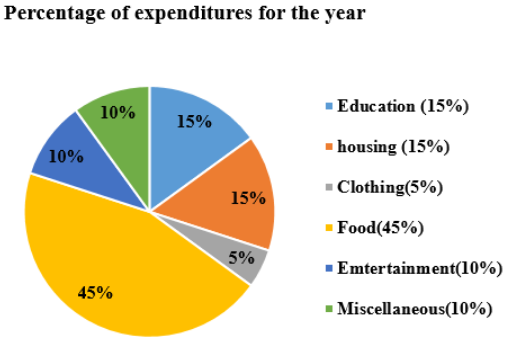
Study the given pie-chart and answer the question that follows. The pie-chart shows the expenditure by a family on different heads.
The angle formed by the sector representing education at the centre of the circle is: |
45° 54° 67° 60° |
54° |
15% = \(\frac{3}{20}\) Sector angle for education = \(\frac{3}{20}\) × 360° = 54° |