CUET Preparation Today
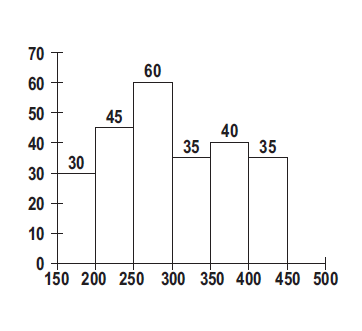
Study the histogram that shows the marks obtained by students in Maths.
By what percentage is no. of students whose obtained marks between 150 and 250 less than the no. of students whose obtained marks are between 250 and 300 and between 350 and 400? |
15% 75% 25% 45% |
25% |
No. of students who obtained marks between 150 and 250 = 75 No. of students who obtained marks b/w 250 and 300 and b/w 350 and 400 = 60 + 40 = 100 Required percentage = \(\frac{100 - 75}{100}\) × 100 = 25% |