
The logistic growth curve of a population can be represented by -
Answer & explanation
Correct answer: option 2
The correct answer is Option (2) → S-shaped curve
In logistic growth a population starts slowly, then grows fast, and finally levels off when its size reaches the carrying capacity (K), the largest number the environment can support. Plotted against time, this gives an S-shaped (sigmoid) curve.
(1) J-shaped curve — Incorrect. This is the curve of exponential growth, where food and space are unlimited. The population keeps rising faster and faster and never levels off.
(2) S-shaped curve — Correct. Growth slows and stops near K, so the curve bends flat at the top.
(3) Bell shaped curve — Incorrect. A bell curve rises and then falls. Logistic growth rises and then stays level.
(4) Linear growth curve — Incorrect. A population does not add the same number each time. Its growth rate changes with its size.
NCERT Extract:
Population Growth – “… A plot of N in relation to time (t) results in a sigmoid curve. This type of population growth is called Verhulst-Pearl Logistic Growth (Figure 11.3) and is described by the following equation:
\( \displaystyle\frac{dN}{dt} = rN\left(\frac{K-N}{K}\right) \)
Where N = Population density at time t
r = Intrinsic rate of natural increase
K = Carrying capacity
Since resources for growth for most animal populations are finite and become limiting sooner or later, the logistic growth model is considered a more realistic one.”
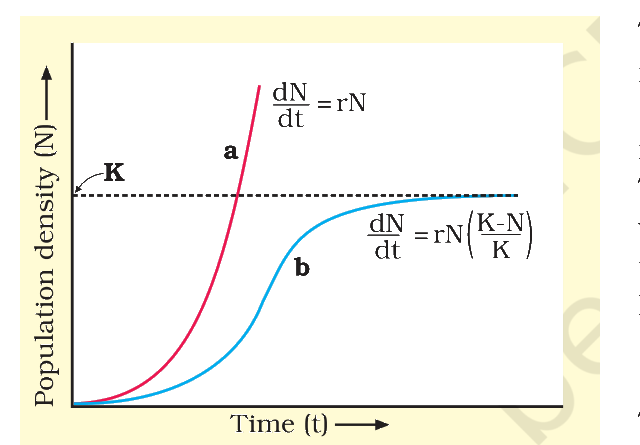
Figure 11.3 Population growth curve a when responses are not limiting the growth, plot is exponential, b when responses are limiting the growth, plot is logistic, K is carrying capacity