CUET Preparation Today
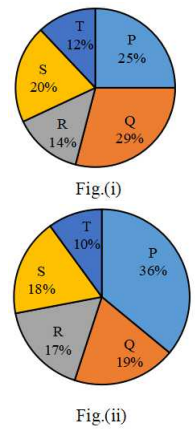
Study the given pie charts and answer the question that follows. The pie charts show the distribution of students of graduate and postgraduate levels in five different institutes P, Q, R, S and T in a town.
The difference between the average number of students of graduate level in institutes P, R and T to the average number of students of postgraduate level in institutes P, R and is: |
425 426 328 428 |
428 |
Total number of students in graduate level = 12400 Average number of students of graduate level in P, R and T = \(\frac{1 }{3}\) × \(\frac{ 25 + 14 + 12 }{100}\) × 12400 = \(\frac{1 }{3}\) × \(\frac{ 51 }{100}\) × 12400 = \(\frac{1 }{3}\) × 6324 = 2108 Total number of students in graduate level = 8000 Average number of students of graduate level in P, R and T = \(\frac{1 }{3}\) × \(\frac{ 36 + 17 + 10 }{100}\) × 8000 = \(\frac{1 }{3}\) × \(\frac{ 63 }{100}\) × 8000 = \(\frac{1 }{3}\) × 5040 = 1680 Required difference = 2108 - 1680 = 428
|