CUET Preparation Today
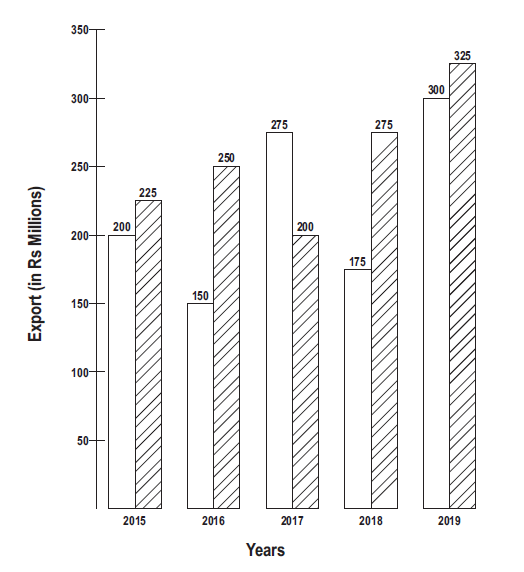
The bar graph shows the exports of Jeeps of type A and type B (in Rs. Million) from 2015 to 2019. A → Blank candles B → Line candles
What is the ratio of total exports of Jeep of type A in 2015 and 2018 to the total exports of Jeep of type B in 2016 and 2017? |
5 : 6 6 : 4 3 : 4 7 : 8 |
5 : 6 |
Export of Jeep of type A in 2015 and 2018 = 200 + 175 = 375 Export of Jeep of type B in 2016 and 2017 = 250 + 200 = 450 Ratio → 375 : 450 75 : 90 5 : 6 |