CUET Preparation Today
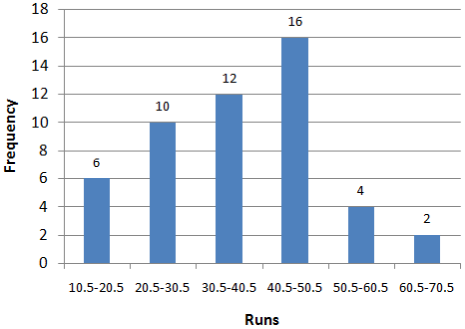
The given histogram represents the frequency distribution of average runs scored by 50 selected players from a district in a local cricket tournament.
How many players scored more than 30.5 on average? |
34 28 16 12 |
34 |
Number of players score more than 30.5 = 12 + 16 + 4 + 2 = 34 |