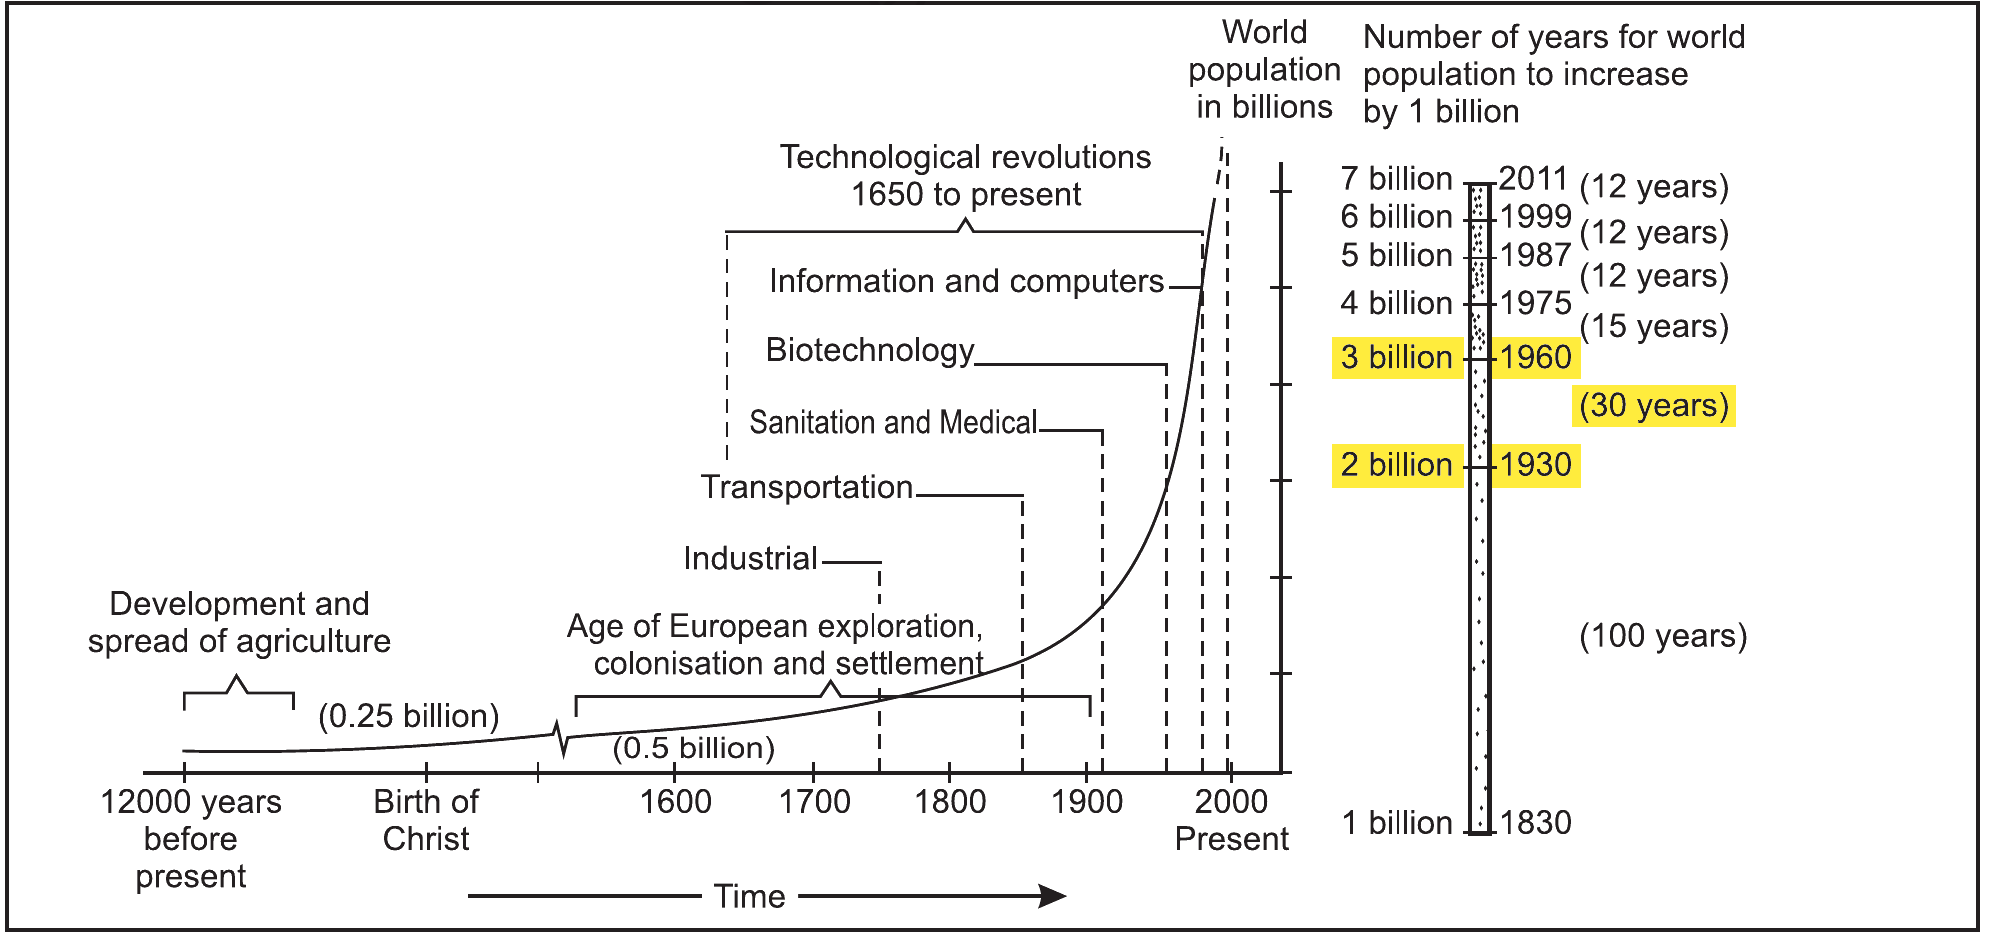
Study the diagram carefully and attempt the questions.
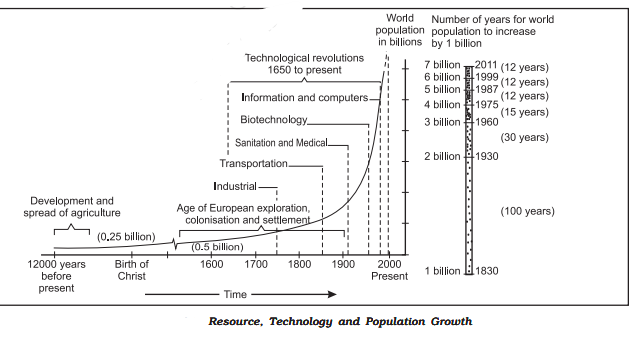
Between 1930 and 1960, the simple average rate of increase in world population shown in the diagram is __________.
Answer & explanation
Correct answer: option 2
The correct answer is Option (2) → 0.033 billion/year
- World population in 1930 = 2 billion; in 1960 = 3 billion
- Increase = 3 − 2 = 1 billion in 1960 − 1930 = 30 years
- Simple average rate = 1 billion ÷ 30 years = 0.033 billion/year
Note: This question is taken from the pre-rationalised NCERT book. The latest edition (2026-27) does not have this part. An extract of the pre-rationalised NCERT book is given below for the benefit of students.
Pre-rationalised NCERT:
Fig. 2.2: Resource, Technology and Population Growth |