CUET Preparation Today
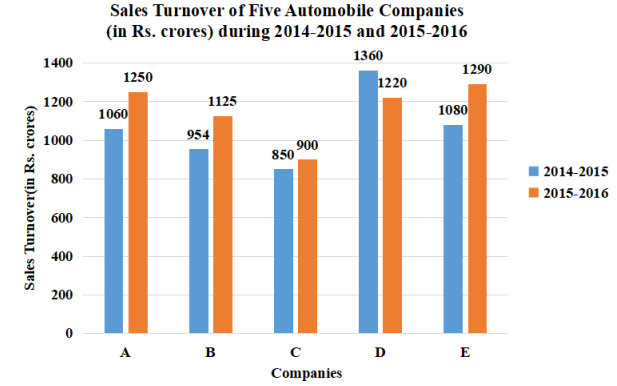
Study the given bar graph and answer the question that follows. The given bar graph represents the Sales Turnover (in 2 crore) of five automobile companies A. B. C.D and E during 2014-2015 and 2015-2016. The X-axis represents the Companies, and the Y-axis shows the Sales Turnover (in 2 crore). (The data shown here is only for mathematical exercise. They do not represent the actual figures of the company.)
If there was an increase of 25% in the average of the sales turnover of all the companies together in 2014-2015 from that in 2013-2014, then what was the average (in 2 crore, up to two decimal places) of the sales turnover of all the companies together in 2013-2014 ? |
848.64 588.96 806.21 985.67 |
848.64 |
Average of sales turnover in 2014 - 2015 = \(\frac{1060+954+850+1360+1080 }{5}\) = \(\frac{ 5304 }{5}\) = 1060.8 ATQ , 25% = \(\frac{ 1 }{4}\) Ratio of average sale turnover of company in 2013 - 2014 to 2014 - 2015 = 4 : 5 Now , 5R = 1060.8 1R = 212.16 Average sales turnover of company in 2013 - 2014 = 212.16 × 4 = 848.64 |