CUET Preparation Today
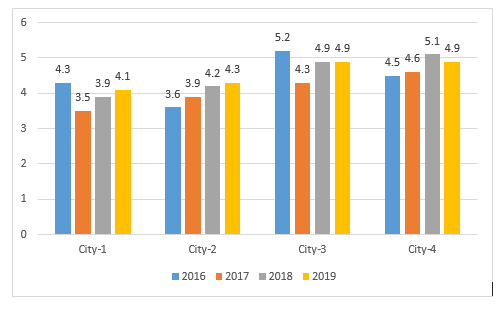
The following graph shows the sales of cars (in thousands)in four cities in 4 years. Study the graph and answer the question.
In 2019, what is the average number of sales among all four cities? In 2019, what is the average number of sales among all four cities? |
4280 4178 3980 4550 |
4550 |
Total sale of 2019 = 4.1 + 4.3 + 4.9 + 4.9 = 18.2 Average sale of 2019 = \(\frac{18.2 }{4}\) = 4.55 |