CUET Preparation Today
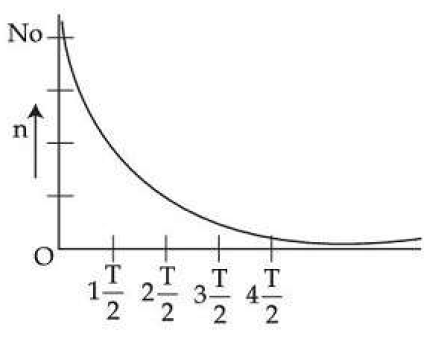
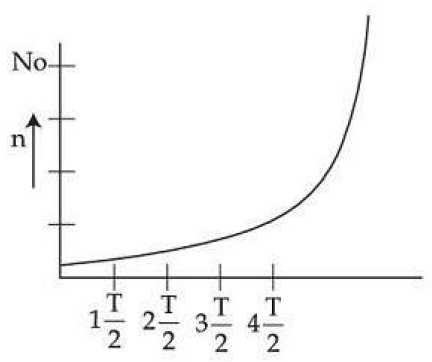
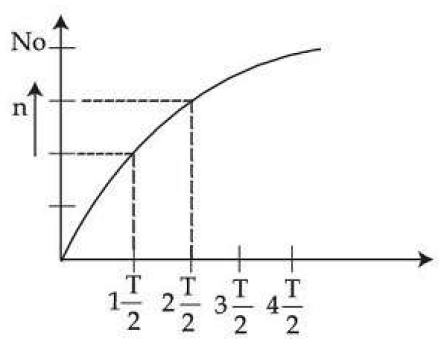
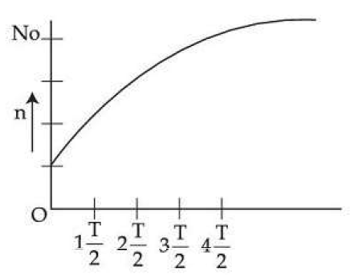
The graph showing number of decayed nuclei verses time t is : |
|
|
$N = N_0 e^{-\lambda t}$ $\text{Number of decayed nuclei} = N_0 - N = N_0(1 - e^{-\lambda t})$ $t=0 \Rightarrow \text{decayed nuclei} = 0$ $t \to \infty \Rightarrow \text{decayed nuclei} \to N_0$ $\text{Thus, graph starts from } 0 \text{ and increases asymptotically to } N_0$ The graph is an increasing exponential curve approaching $N_0$ asymptotically. |