CUET Preparation Today
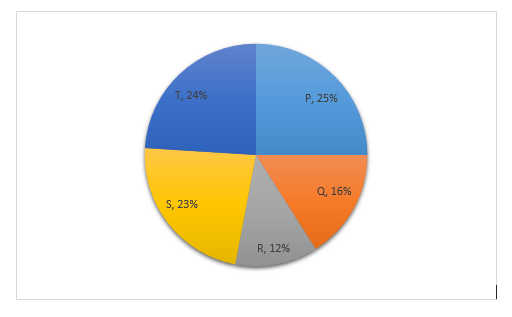
The pie-chart shows the percentage-wise distribution of the number of students in five different schools P, Q, R, S and T. The total number of students in all five schools is 10,500. Study the pie-chart and answer the question.
The difference between the central angles corresponding to schools T and R is : |
34.5° 44° 43.2° 42.8° |
43.2° |
Difference between the central angles corresponding to schools T and R = \(\frac{24-12}{100 }\) × 360º = \(\frac{12}{100 }\) × 360º = 43.2º |