CUETMOCK
  • Pricing
  • Mentors
Log inStart freeStart free mocks→

First test, then trust

Try a free CUET mock test.

Join 5,00,000+ students who rehearsed exam day on the exact NTA screen before sitting CUET. On the web and on Android.

Start free mocks →Get the Android app
CUETMOCK

India's #1 CUET Mock Test Platform. Original NCERT-based questions on the exact NTA exam screen — trusted by 5,00,000+ students since CUET 2022.

Get it onGoogle PlayScan to download the CUETMOCK app

Mock tests

  • CUET mock test series
  • Browse all papers
  • Commerce mocks
  • Humanities (Arts) mocks
  • Science mocks
  • Languages & GAT mocks
  • Free practice questions
  • Pricing

Resources

  • CUET exam guide
  • CUET syllabus
  • Universities accepting CUET
  • Expert blogs
  • News & notifications
  • Webinars & counselling
  • CUET score calculator
  • How we estimate your rank
  • FAQs

Company

  • About us
  • Our leadership & team
  • Our toppers
  • Mentors
  • For schools
  • Contact us
  • Terms
  • Privacy
  • Refund policy

Talk to us

+91 7696 6630 56info@cuetmock.comWhatsApp us

Our other platforms

  • JEE Mock — For IIT-JEE aspirants
  • NEET Mock — For NEET aspirants

Newsletter

Exam updates, study material and offers — no spam.

© 2026 NYC Ventures Pvt. Ltd.

701-702, Royal Business Park, Zirakpur, Punjab - 140603

  • Terms of use
  • Privacy policy
  • Refund policy
  • Contact us

iCUETMOCK is an independent preparation platform, not affiliated with the National Testing Agency (NTA). Always check exam details on the official NTA website.

  • Home
  • Mock tests
  • CUET guide
  • Pricing
  • Log in
Home/Practice questions/Accountancy Part C
Accountancy Part CGraphs and Charts for Business Data

Arrange the following steps related to the preparation of a chart in…

Arrange the following steps related to the preparation of a chart in sequence, in case of CAS.

(A) Enter data in a worksheet with proper column and row titles
(B) Create a basic chart using the pattern from the panel available
(C) Move (resize) a chart.
(D) Save a chart
(E) Change the layout or style of chart

Choose the correct answer from the options given below:

Answer & explanation+

Correct answer: option 4

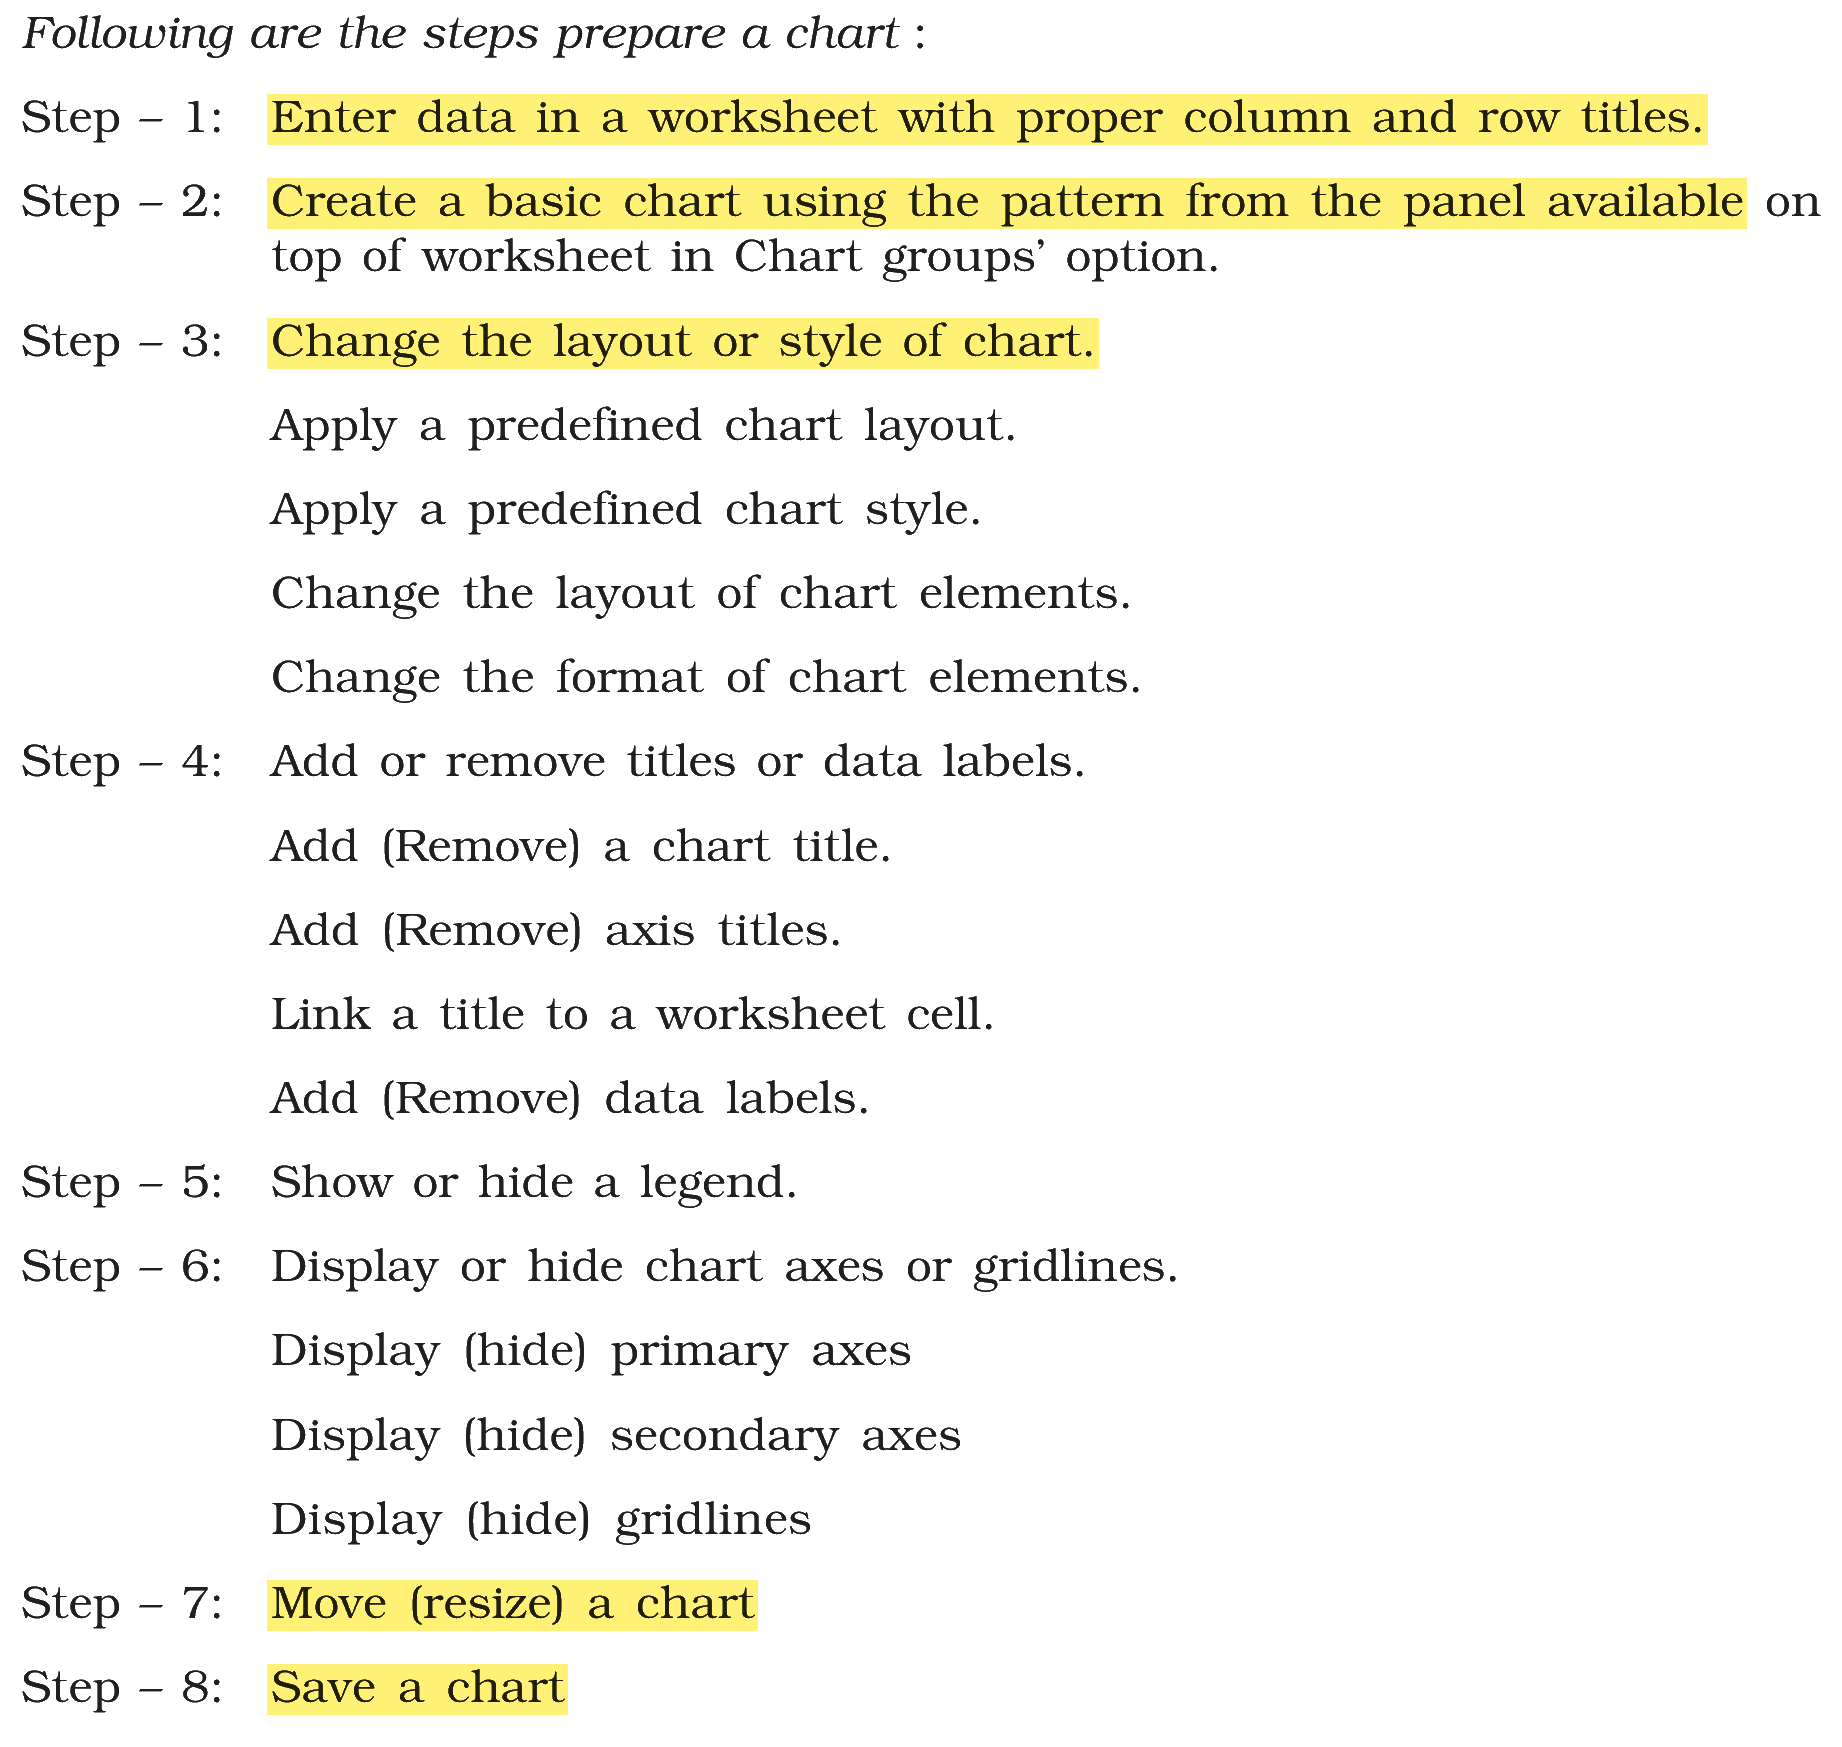
The correct answer is Option (4) → (A), (B), (E), (C), (D)

A chart is built from data, then shaped, then placed and kept.

(A) Enter data in a worksheet with proper column and row titles — step 1.
(B) Create a basic chart using the pattern from the panel available — step 2.
(E) Change the layout or style of chart — step 3.
(C) Move (resize) a chart — step 7, after titles, legend and axes are set.
(D) Save a chart — the last step.

NCERT (2026-27 edition):
Summary

Extract from the NCERT textbook

Advertisement

Practise more on Graphs and Charts for Business Data

Chapter-wise mocks on the real NTA exam screen, with solutions and your rank. Your first mocks are free.

Start free mocks →

Advertisement

Next questions

  1. The IUPAC name of the following compound isChemistry · Organic: Aldehydes, Ketones and Carboxylic Acids
  2. As per a study, the oceans have become noisier by how many times in last 40 years?Geography · India-People and Economy: Geographical Perspective on selected issues and Problems
  3. Kshitindranath Majumdar, an early student of Abanindranath Tagore, painted mythological and religious subjects. Four paintings are named be…Fine Arts · The Bengal School and Cultural Nationalism
  4. ΔPQR is a right angled triangle. ∠Q = 90 degree, PQ = 9 cm and QR = 11 cm. What is the value of cot P ?General Aptitude Test · Quantitative Reasoning
  5. A man purchases some oranges at the rate of 3 for ₹40 and the same quantity at the rate of 5 for ₹60. If he sells all the oranges at the ra…General Aptitude Test · Numerical Ability
  6. Which step of controlling states that "performance should be measured in an objective and reliable manner"?Business Studies · Controlling
  7. Nhava Sheva is another name of _____.Geography · India-People and Economy: International Trade
  8. The interval(s), where the function f(x) = […] is increasing, is/are:Applied Maths. Section B2 · Calculus
  9. A discrete random variable X takes the values 0, 1, 2, 3, 4 and its mean is 1.6. If P(X = 1) = 0.4, P(X = 4) = P(X = 2) and P(X = 3) = 2P(X…Applied Maths. Section B2 · Probability Distributions
  10. Carbylamine reaction is used as a test forChemistry · Organic: Amines