CUET Preparation Today
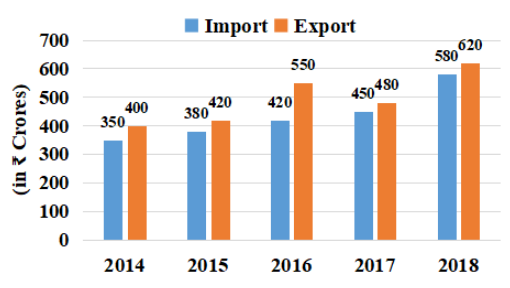
The given bar graph shows the imports and exports (in crore ₹) of steel for 5 years from 2014 to 2018.
What is the ratio of average export to average import over the five years? |
247 : 109 247 : 218 109 : 247 218 : 247 |
247 : 218 |
Average Export : Average Import \(\frac{400+420+550+480+620}{5}\: \(\frac{350+380+420+450+580}{5}\) \(\frac{ 2470 }{5}\) : \(\frac{ 2180 }{5}\) 494 : 436 247 : 218 |