CUET Preparation Today
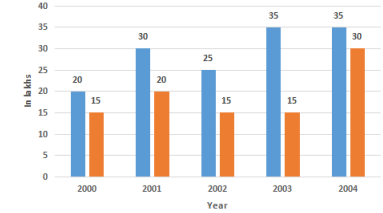
In the given bar graph, the white bar shows the income and the black bar shows the expenditure of company(in lakhs). Study the graph and answer the question that follows.
The percentage decrease in the income of the company in 2002 as compared to that in 2001 is: |
18% $24\frac{1}{3}$% $16\frac{2}{3}$% 22% |
$16\frac{2}{3}$% |
Income in 2001 = 30 Income in 2002 = 25 Percentage decrease in income of company in 2002 compared to 2001 = \(\frac{30 - 25 }{30}\) × 100 = \(\frac{5 }{30}\) × 100 = 16\(\frac{2}{3}\)% |