According to Freundlich adsorption isotherm the correct graph is:
Answer & explanation
Correct answer: option 3
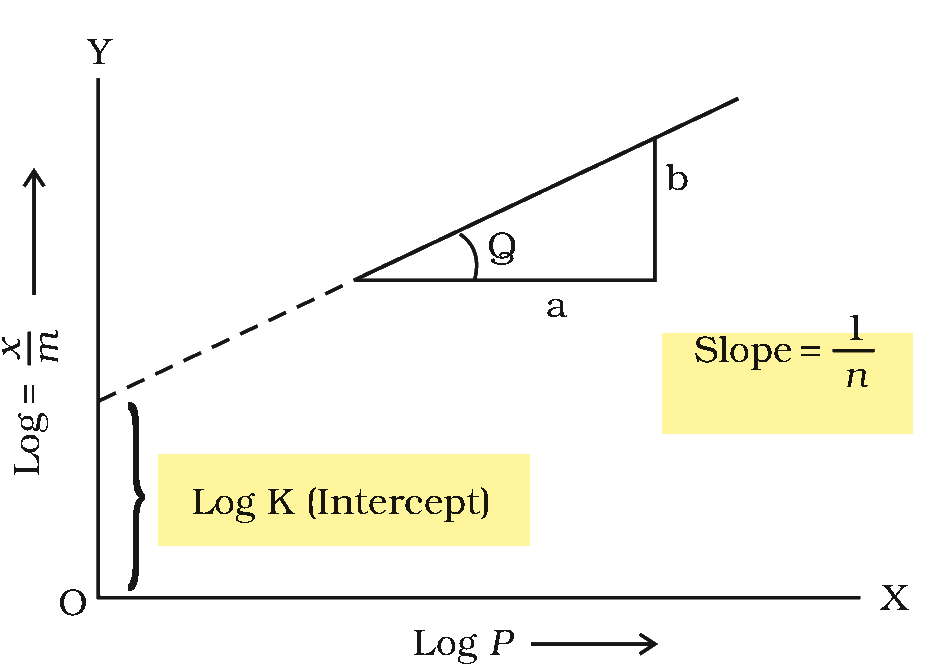
The correct answer is Option (3) → the straight-line plot of log x/m against log P in Option (3)
The Freundlich adsorption isotherm relates the mass of gas adsorbed per gram of adsorbent (x/m) to the pressure at a fixed temperature:
x/m = k P1/n (n > 1)
Taking logarithms gives the equation of a straight line:
log (x/m) = log k + (1/n) log P
So a plot of log x/m (y-axis) against log P (x-axis) is a straight line with slope 1/n and intercept log k on the y-axis.
Why the other options are incorrect
Option (1) — Incorrect. A curve that rises and levels off, plotted against P; it is the shape of x/m against P (saturation at high pressure), not of log x/m against log P.
Option (2) — Incorrect. A curve that rises steeply again at high pressure is not described by the Freundlich equation, which gives a straight line on log-log axes.
Option (4) — Incorrect. The straight line passes through the origin, which would mean log k = 0 (k = 1); in general the line cuts the log x/m axis at log k.
Note: This question is from the pre-rationalised NCERT book (2022-23). The topic is not there in the latest NCERT book (2026-27), and it is also out of the CUET 2026 syllabus.
NCERT (Pre-rationalised edition, 2022-23):
Adsorption Isotherms – “… The validity of Freundlich isotherm can be verified by plotting log x/m on y-axis (ordinate) and log P on x-axis (abscissa). If it comes to be a straight line, the Freundlich isotherm is valid, otherwise not (Fig. 5.2).”