CUET Preparation Today
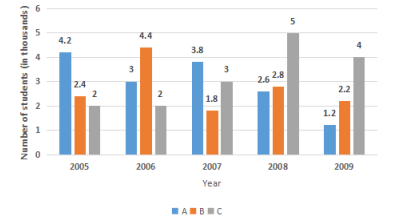
The following graph below shows the number of students (in thousands) who were admitted to three different courses in 5 years in a university. Study the graph and answer the question.
What is the ratio of the number of students who were admitted to course A in the year 2007 to that of students who were admitted to course C in the year 2009? |
$\frac{9}{20}$ $\frac{21}{20}$ $\frac{23}{20}$ $\frac{19}{20}$ |
$\frac{19}{20}$ |
Number of students admitted in course A in 2007 = 3.8 Number of students admitted in course C in 2009 = 4 Required Ratio = \(\frac{3.8 }{4}\) = \(\frac{19 }{20}\) |