CUET Preparation Today
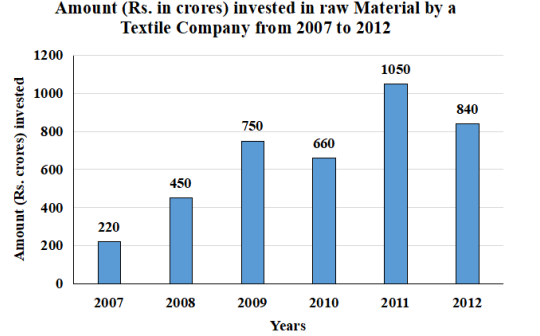
Study the given bar graphs and answer the question that follows. The bar graphs represent the amount invested in raw materials (in 2 crore) and the sale of the products, by a textile company in the years 2007— 2012. The X-axis represents the years. The Y-axis represents the amount invested in raw materials (in 2 crore) in figure 1 and sale of products in figure 2, respectively.
Figure 1
Figure 2 In which two years was the difference of the amount invested and the sales of products the same? |
2009 and 2012 2010 and 2011 2007 and 2009 2008 and 2011 |
2008 and 2011 |