CUET Preparation Today
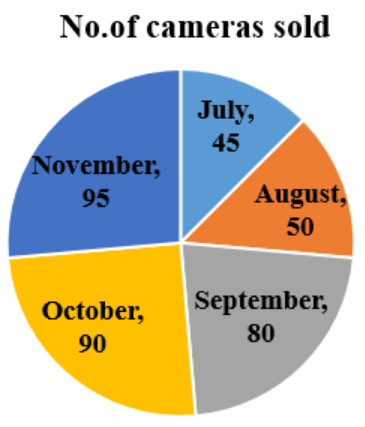
The following pie chart gives the central angles of the sectors representing the number of cameras sold from a shop from July to November in a certain year.
What percentage are the sales in July of the total sales from July to November? |
25% 50% 12.5% 20% |
12.5% |
Total sale from July to November = 45 + 50 + 80 + 90 + 95 = 360 Sale in July = 45 Percentage of sale in July to Total sale = \(\frac{45 }{360}\) × 100 = 12.5% |