CUET Preparation Today
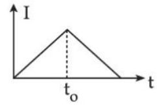
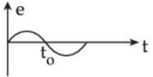
The current I in an inductance coil varies with time according to the graph shown. Which one of the following plots shows the variation of voltage in the coil with time?
|
|
|
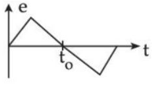
The correct answer is Option (3)
for time interval $0<t_0<t/2$ $I=-Kt$, where $-k$ is slope. and, for inductor - $V=-L\frac{di}{dt}⇒v_1=+KL$ $⇒I_1=+Kt$, where K is slope. |