CUET Preparation Today
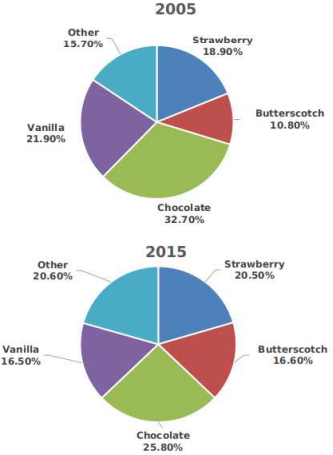
The given pie charts represent the popularity of ice-cream flavours in the years 2005 and 2015.
If a percentage point shift results in annual additional sales of ₹ 5,000, how much(in ₹), did the combined annual strawberry and butterscotch sales increase from 2005 to 2015? |
74,000 37,000 65,000 10,000 |
37,000 |
Total sale in 2005 = 10.80% + 18.90% = 29.7% Total sale in 2015 = 20.50% + 16.60% = 37.1% Percentage increase from 2015 to 2005 = 37.1% - 29.7% = 7.4% ATQ , = 7.4 × 5000 = 37000 |