
Given diagram is a Geometric Representation of Profit Maximisation (Short Run). Study the diagram given below and answer the question.
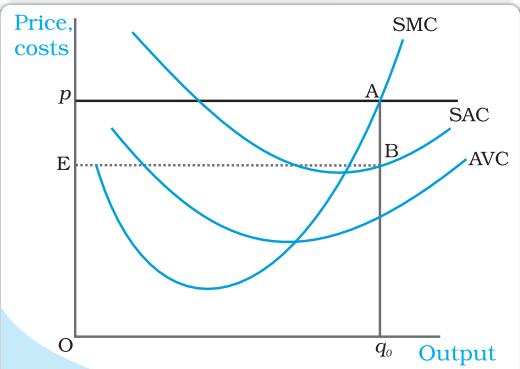
If the market price fell to the minimum of SAC, the firm would:
Answer & explanation
Correct answer: option 3
The correct answer is Option (3) → earn only normal profit
At the minimum of SAC, price just equals average cost, so the profit rectangle EpAB disappears. Normal profit is a part of costs, so the firm earns only normal profit. This is its break-even point.
Option (1) earn the same profit as before — Incorrect. A lower price cuts the gap between price and average cost; here it falls to zero.
Option (2) make a loss equal to its total fixed cost — Incorrect. That loss comes only from producing nothing. Here TR covers TC.
Option (3) earn only normal profit — Correct. Price = minimum SAC is the short run break-even point.
Option (4) produce zero output — Incorrect. Output stops only when price falls below the minimum AVC, which lies lower than the minimum SAC.
NCERT (2026-27): “4.4.4 The Normal Profit and Break-even Point The minimum level of profit that is needed to keep a firm in the existing business is defined as normal profit. A firm that does not make normal profits is not going to continue in business. Normal profits are therefore a part of the firm’s total costs. … The point on the supply curve at which a firm earns only normal profit is called the break-even point of the firm. The point of minimum average cost at which the supply curve cuts the LRAC curve (in short run, SAC curve) is therefore the break-even point of a firm.” |