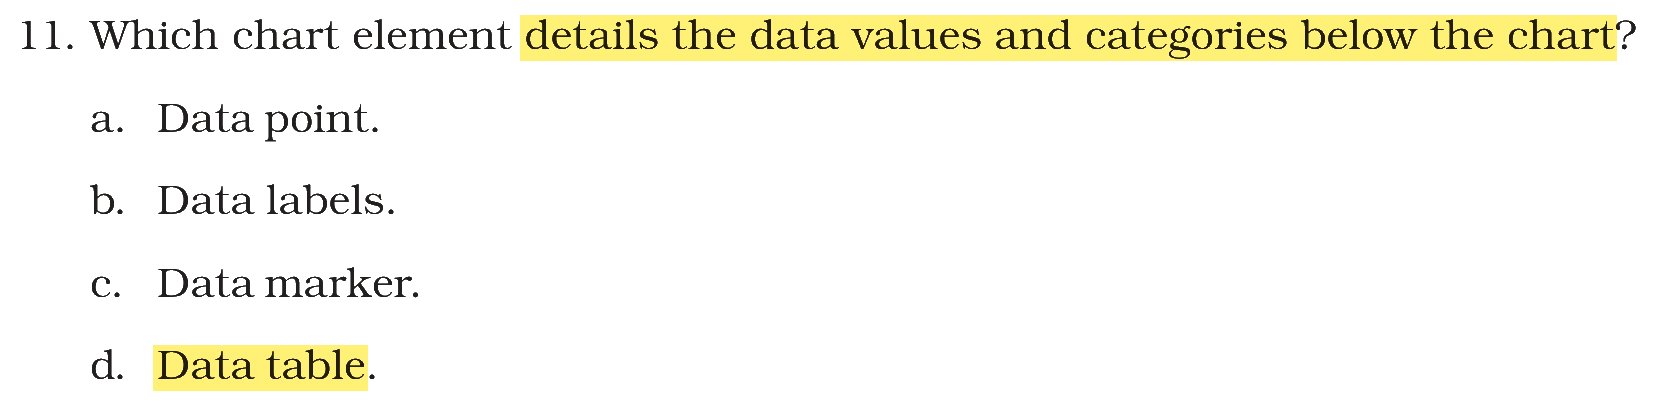
Identify the chart element that details the data values and categories below the chart.
Answer & explanation
Correct answer: option 2
The correct answer is Option (2) → Data table
A data table is a small grid attached below the chart. It shows the value of each data series against each category, so the reader sees the exact figures along with the picture.
Option (1) Data marker — Incorrect. A data marker is the bar, column, dot or pie slice that stands for one value inside the plot area. It is a shape, not a table of values.
Option (2) Data table — Correct. It lists the data values and the categories in rows and columns under the chart.
Option (3) Data point — Incorrect. A data point is one single value plotted in the chart. It is shown by a data marker and does not list all the values below the chart.
Option (4) Data labels — Incorrect. A data label gives extra information about a data marker, such as its value, and is placed on or next to that marker inside the chart, not below it.
Note: The answer key at the end of the NCERT chapter prints ‘b’ (Data labels) for this exercise question. This seems to be a misprint in the book’s key. The book itself says that a data label “provides additional information about a data marker”, that is, about one value in the chart. The element that shows the data values and categories below the chart is the data table.
NCERT (2026-27 edition): Exercise
|