
For a strong electrolyte, the plot of molar conductivity (Λm) against \(\sqrt{c}\) is
Answer & explanation
Correct answer: option 2
The correct answer is Option (2) → Linear, with a negative slope
For a strong electrolyte such as KCl, Λm increases slowly on dilution and decreases linearly with c1/2:
\( \displaystyle \Lambda_m=\Lambda^{\circ}_m-A\,c^{1/2} \)
This has the form y = b − Ax, so Λm against √c is a straight line with intercept Λ°m and slope −A (negative).
Why the other options are incorrect
Option (1) Parabolic — Incorrect. Λm is a first-power function of √c, so the plot is a straight line, not a parabola.
Option (3) Linear, with a positive slope — Incorrect. Λm decreases as the concentration rises, so the slope cannot be positive.
Option (4) A curve that rises steeply as the concentration approaches zero — Incorrect. This is the plot of a weak electrolyte such as acetic acid, whose degree of dissociation rises sharply on dilution.
NCERT (2026-27 edition):
2.4.2 Variation of Conductivity and Molar Conductivity with Concentration – “For strong electrolytes, Λm increases slowly with dilution and can be represented by the equation:
\( \displaystyle \Lambda_m=\Lambda^{\circ}_m-A\,c^{1/2} \qquad (2.23) \)
It can be seen that if we plot (Fig. 2.6) Λm against c1/2, we obtain a straight line with intercept equal to Λ°m and slope equal to ‘–A’.”
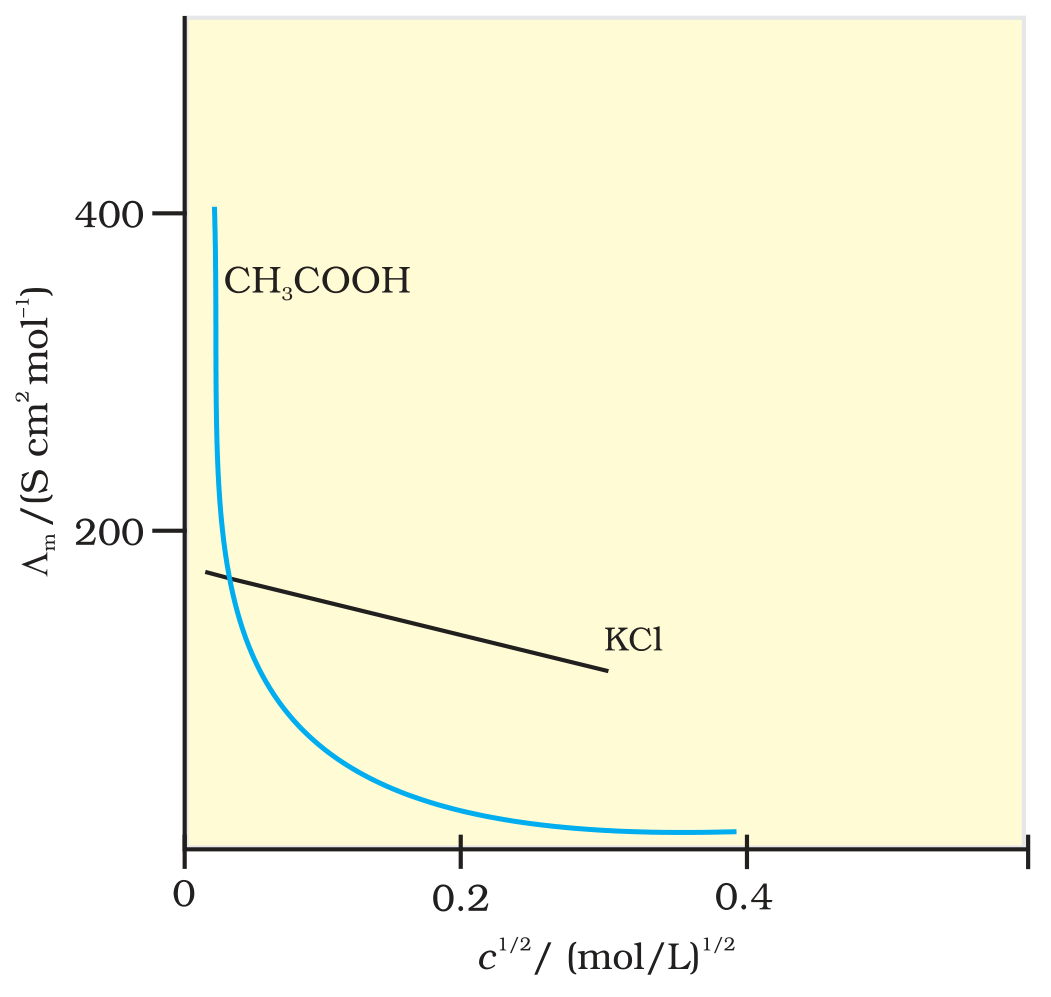
Fig. 2.6: Molar conductivity versus c½ for acetic acid (weak electrolyte) and potassium chloride (strong electrolyte) in aqueous solutions.