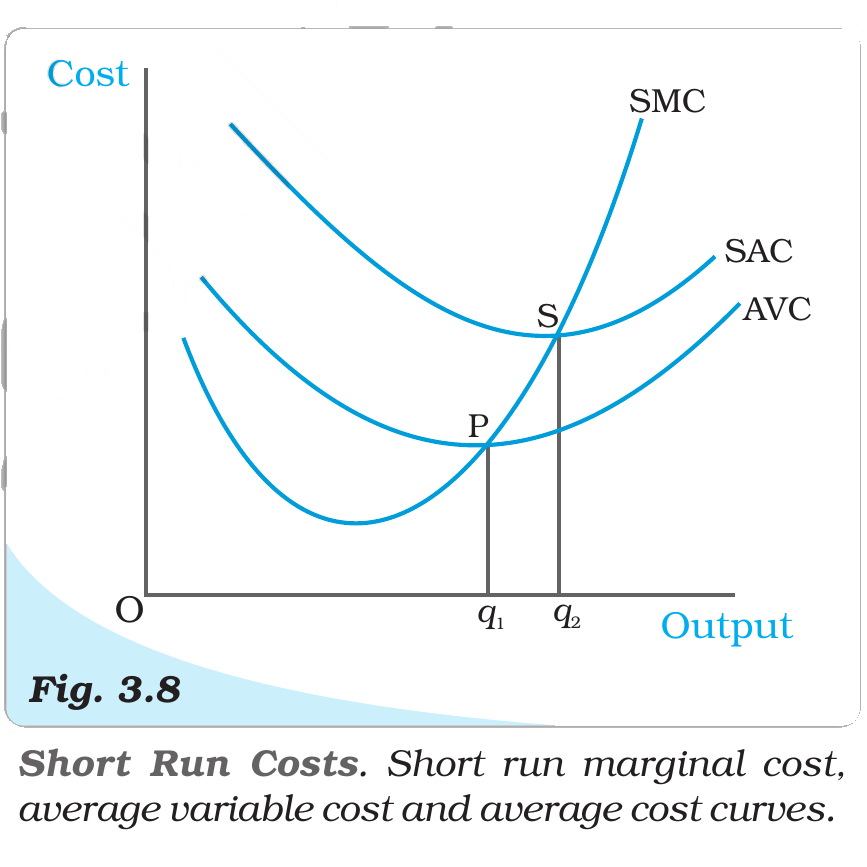
Select the correct statements in respect to the relationship between short-run cost curves.
A. Marginal cost (SMC), average variable cost (AVC) and short run average cost curves (SMC) are ‘U’ shaped.
B. SMC curve cuts the AVC curve from below at the minimum point of AVC.
C. AVC curve cuts the SMC curve from below at the minimum point of SMC.
D. SMC curve cuts the SAC curve from below at the minimum point of SAC.
Choose the correct answer from the options given below:
Answer & explanation
Correct answer: option 2
The correct answer is Option (2) → A, B and D only
In the short run some inputs are fixed, so a firm’s cost has two parts: fixed cost, which stays the same whatever the output, and variable cost, which changes with output. Per unit of output these give average fixed cost (AFC) and average variable cost (AVC), and their sum is the short run average cost (AC or SAC). Short run marginal cost (SMC) is the extra cost of producing one more unit.
The shapes of these curves follow from two ideas:
The law of variable proportions: as more of the variable input is used with the fixed inputs, its marginal product first rises and then falls. Each extra unit of output therefore needs less of the variable input at first and more later, so SMC first falls and then rises.
The marginal–average relation: an average falls while the marginal value is below it and rises once the marginal value is above it. So AVC and AC fall while SMC is below them and rise once SMC is above them, and the SMC curve cuts each of them from below at its minimum point.
Taking the statements one by one:
A. Marginal cost (SMC), average variable cost (AVC) and short run average cost curves (SMC) are ‘U’ shaped. Correct. SMC first falls and then rises as the marginal product rises and then falls. AVC keeps falling while SMC is below it and starts rising once SMC is above it. The short run average cost (SAC) is AVC plus AFC: it falls at first, and rises once the rise in AVC outweighs the fall in AFC. So all three curves are U-shaped.
B. SMC curve cuts the AVC curve from below at the minimum point of AVC. Correct. SMC is below AVC while AVC is falling and above it while AVC is rising, so it crosses the AVC curve from below where AVC stops falling, at its minimum.
C. AVC curve cuts the SMC curve from below at the minimum point of SMC. Incorrect. It is the SMC curve that cuts the AVC curve, and the point is the minimum of AVC, not of SMC. SMC reaches its lowest point first and is already rising by the time it meets the AVC curve.
D. SMC curve cuts the SAC curve from below at the minimum point of SAC. Correct. The same relation holds for SAC: SMC lies below SAC while SAC is falling and above it while SAC is rising, so it cuts the SAC curve from below at its minimum. Since SAC also contains AFC, this minimum lies to the right of the minimum of AVC.
Note 1: It seems that there is a mistake in the original NTA paper, which prints ‘short run average cost curves (SMC)’ in statement A when it should read ‘short run average cost curves (SAC)’. SMC already stands for marginal cost at the start of the same sentence, and the statement lists the three U-shaped curves SMC, AVC and SAC, so the meaning is clear.
Note 2: A same/similar question was asked in CUET (UG) in the papers below.
| 2026 | 2025 | 2024 | 2023 | 2022 |
| 13-05 S2 21-05 S2 | – | – | – | – |
NCERT (2025-26): “Shapes of the Short Run Cost Curves … According to the law of variable proportions, initially, the marginal product of a factor increases as employment increases, and then after a certain point, it decreases. This means initially to produce every extra unit of output, the requirement of the factor becomes less and less, and then after a certain point, it becomes greater and greater. As a result, with the factor price given, initially the SMC falls, and then after a certain point, it rises. SMC curve is, therefore, ‘U’-shaped.… Now, what does the AVC curve look like? For the first unit of output, it is easy to check that SMC and AVC are the same. So both SMC and AVC curves start from the same point. Then, as output increases, SMC falls. AVC being the average of marginal costs, also falls, but falls less than SMC. Then, after a point, SMC starts rising. AVC, however, continues to fall as long as the value of SMC remains less than the prevailing value of AVC. Once the SMC has risen sufficiently, its value becomes greater than the value of AVC. The AVC then starts rising. The AVC curve is therefore ‘U’-shaped. As long as AVC is falling, SMC must be less than the AVC. As AVC rises, SMC must be greater than the AVC. So the SMC curve cuts the AVC curve from below at the minimum point of AVC.… Let us now look at SAC. SAC is the sum of AVC and AFC. Initially, both AVC and AFC decrease as output increases. Therefore, SAC initially falls. After a certain level of output production, AVC starts rising, but AFC continuous to fall. Initially the fall in AFC is greater than the rise in AVC and SAC is still falling. But, after a certain level of production, rise in AVC becomes larger than the fall in AFC. From this point onwards, SAC is rising. SAC curve is therefore ‘U’-shaped. It lies above the AVC curve with the vertical difference being equal to the value of AFC. The minimum point of SAC curve lies to the right of the minimum point of AVC curve. Similar to the case of AVC and SMC, as long as SAC is falling, SMC is less than the SAC. When SAC is rising, SMC is greater than the SAC. SMC curve cuts the SAC curve from below at the minimum point of SAC. Figure 3.8 shows the shapes of short run marginal cost, average variable cost and short run average cost curves for a typical firm.…”
|